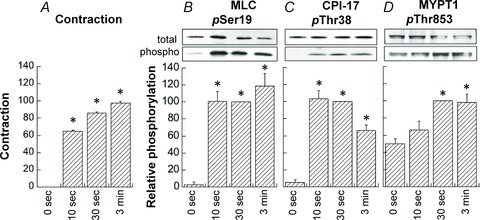
Figure 13. Time course of phosphorylation of MLC (B), CPI-17 (C) and MYPT1 (D) compared with that of contraction (A) in response to 30 μm PE in small rat mesenteric artery.

Average values of phosphorylation were normalized with a respective value at 30 s after PE stimulation. Contractions were normalized with a maximum at 3 min. *Significant difference (P < 0.05) from the resting value at 0 s. n= 4–8.
