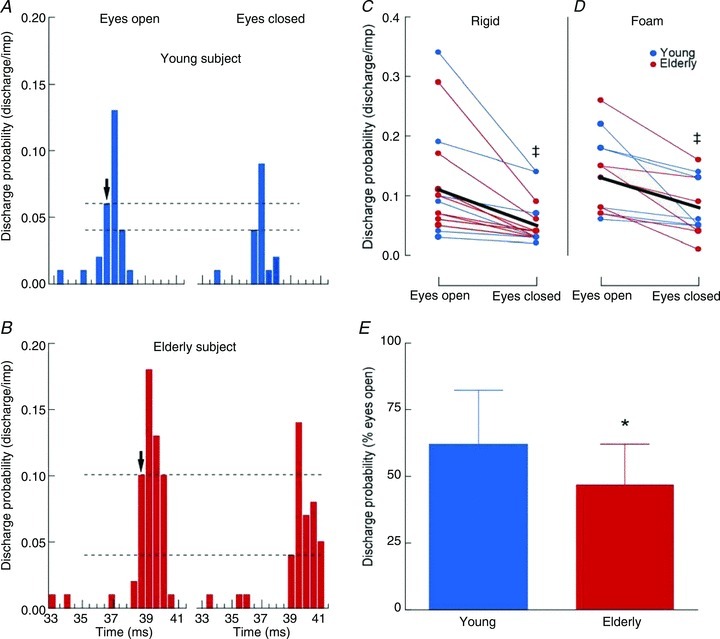
Figure 6. Post-stimulus time histograms (PSTHs) derived from single motor unit recordings.

A and B, post-stimulus time histogram (see Methods) for one young (A) and one elderly adult (B) in the two vision conditions when standing on a rigid surface. Motor unit discharge probability is expressed as discharge/impulse for 0.5 ms bins. The arrows indicate the onset of the peak of motor unit discharge in response to tibial nerve stimulation and dashed lines underline the changes in the first 0.5 ms bin of the peak between the two vision conditions. C and D, discharge probability of motor units within the first 0.5 ms bin of the peak of the PSTH during upright stance on a rigid (n = 18; C) and a foam surface (n = 13; D) with eyes open and closed in young (blue dots) and elderly adults (red dots). The thick black line represents the mean values of discharge probability when data from young and elderly adults are pooled together. E, changes in discharge probability within the first 0.5 ms bin of the peak of the PSTH with eye closure (expressed as a percentage of discharge probability for the eyes open condition) in young (blue bar) and elderly adults (red bar) for data collapsed across surface conditions. * Significant differences between age groups, P < 0.05. ‡ Significant differences between vision conditions, P < 0.05.
