Abstract
We have created a dendrimer complex suitable for preferential accumulation within liver tumors and luminescence imaging by substituting thirty-two naphthalimide fluorophores on the surface of the dendrimer and incorporating eight europium cations within the branches. We demonstrate the utility and performance of this luminescent dendrimer complex to detect hepatic tumors generated via direct subcapsular implantation or via splenic injections of colorectal cancer cells (CC531) into WAG/RijHsd rats. Luminescence imaging of the tumors after injection of the dendrimer complex via hepatic arterial infusion revealed that the dendrimer complex can preferentially accumulate within liver tumors. Further investigation indicated that dendrimer luminescence in hepatic tumors persisted in vivo. Due to the incorporation of lanthanide cations, this luminescence agent presents a strong resistance against photobleaching. These studies show the dendrimer complex has great potential to serve as an innovative accumulation and imaging agent for the detection of metastatic tumors in our rat hepatic model.
Keywords: animal model, functionalized dendrimer, luminescence imaging, hepatic tumor, hepatic arterial infusion
1. Introduction
Approximately one-third to one-half of the 150,000 Americans diagnosed with colorectal cancer (CRC) each year [1] will develop hepatic metastasis, and only about 20% of these patients are operable. The five-year survival rate for patients with liver metastasis without treatment is only 5% [2]. Current therapies for treating metastatic lesions include local tumor ablation (i.e., radiofrequency ablation, cryotherapy or direct injection of alcohol or acetic acid directly into the metastatic lesions) [3], transarterial chemoembolization (TACE) [4], embolization with radioactive microspheres, surgical resection and/or systemic therapy consisting of chemotherapeutic and biological agents [5]. While all of these strategies can be used to treat hepatic malignancies, some are surgically invasive and others are associated with significant systemic toxicity due to lack of tumor-specific accumulation. However, the attainment of a tumor-specific agent that maximizes treatment efficacy while minimizing systemic toxicity remains a difficult feat in cancer therapeutics.
One of our aims is to target with high specificity and image liver tumors in colorectal liver metastases with in vivo and ex vivo WAG/RijHsd rat models. A main requirement to achieve the goal of targeting and evidencing liver metastasis is the creation of a luminescent reporter that will allow for the preferential accumulation of this type of tumor and which will emit a stable luminescence signal that can be easily discriminated from autofluorescence present in biological systems. In this study we have developed a nanoscale dendrimer that preferentially accumulates within tumors in a rat hepatic metastasis model and demonstrated its capacity to optically image liver tumors in vivo.
Dendrimers are discretely organized polymers whose versatility in the fields of drug-delivery, site-specific targeting and labeling have been the subject of many articles and reviews [6-12]. Apart from the core of the dendrimer, the interior branches and surface functional groups offer two regions which can be manipulated in a versatile way to meet the needs of the designers, such as being functionalized to incorporate luminescent molecules [13]. As often observed with small organic fluorophores, photobleaching can be a strong limitation by leading to fluorescent signal decay thereby preventing their use for long-term or repetitive measurements in biological applications. Trivalent lanthanide cations such as europium (Eu3+) have been hypothesized to provide a unique solution to prevent/limit the effects of photobleaching [14]. In this work, we have created a dendrimer-lanthanide complex by attaching luminescent moieties to the surface of the dendrimer through the end branches and incorporating Eu3+ cations in the internal sites, and demonstrated the unique luminescence stability of this complex and its application in our WAG/RijHsd rat models.
2. Materials and Methods
2.1. Synthesis of the generation-3 PAMAM 4-amino-1,8-naphthalimide dendrimer containing europium ions (Eu-G3P4A18N)
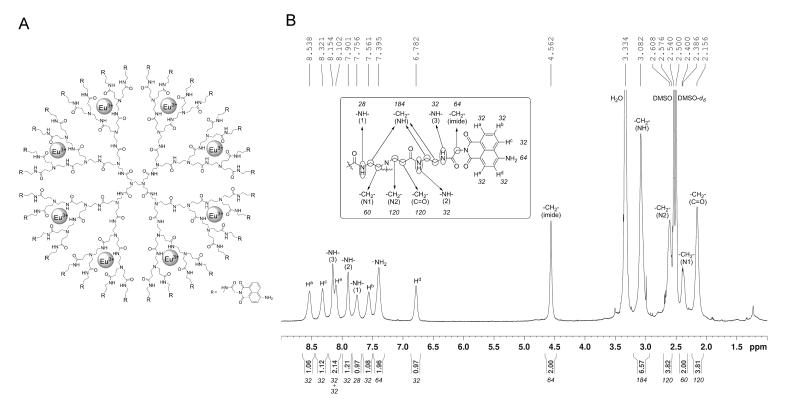
Glycine-conjugated 4-amino-1,8-naphthalimide was synthesized by a reported method [15]. Glycine-conjugated 4-amino-1,8-naphthalimide was attached on the amine-terminated G3 PAMAM dendrimer by a standard amide coupling condition: 54.1 mg (2.00 × 10⁻⁴ mol) of glycine-naphthalimide conjugate was added to a solution of 29.4 mg (4.26 × 10⁻⁶ mol) of G3 PAMAM dendrimer (Dendritech Inc.; Midland, MI, USA) in 5 mL of DMF (Sigma-Aldrich; St. Louis, MO, USA). 92.1 mg (2.42 × 10⁻⁴ mol) of HATU (Aldrich; St. Louis, MO, USA) and 70 μL (52 mg; 4.0 × 10⁻⁴ mol) of DIPEA (Sigma-Aldrich; St. Louis, MO, USA) were added. The reaction mixture was stirred at room temperature for two days under nitrogen atmosphere while monitoring for the disappearance of G3 PAMAM dendrimer by TLC. The compound was purified by dialysis using a regenerated cellulose membrane (nominal MWCO 12,000-14,000; Fisher Scientific; Pittsburgh, PA, USA) in DMSO for three days. The solution recovered from the dialysis membrane was dried in a vacuum oven (40 °C, 50 mbar) to yield G3P4A18N as brown solid (52.5 mg, 82%). 1H-NMR (300 MHz, DMSO-d6): δ 8.54 p.p.m. (br s, 32 H), 8.32 (br s, 32 H), 8.15 (br s, 32 H), 8.10 (br s, 32 H), 7.90 (br s, 32 H), 7.76 (m, 28 H), 7.56 (br s, 32 H), 7.40 (br s, 64 H), 6.78 (br s, 32 H), 4.56 (br s, 64 H), 3.08 (m, 184 H), 2.61 (m, 120 H), 2.39 (m, 60 H ), 2.16 (m, 120 H); analysis (% calcd, % found for C750H864N186O156·32DMSO·64H2O): C (52.47, 51.74), H (6.40,6.29), N (13.98, 13.76) (Fig. 1B). The Eu3+ complex of G3P4A18N (Eu-G3P4A18N) was synthesized by the following method adapted from one of our methods [16]: 22.67 mg (1.513 × 10⁻⁶ mol) of G3P4A18N was dissolved in 10 mL of DMSO. 647.5 μL of 18.7 mM Eu(NO3)3 solution in DMSO (1.21 × 10⁻⁵ mol) was added to the dendrimer solution. The mixture was diluted to 25.00 mL, incubated at room temperature for seven days. The resulting solution (conc. = 60.5 μM) was used as obtained.
Fig. 1.
(A) The chemical structure of the Eu-G3P4A18N dendrimer. Substitution of the end branches is designated by R, glycine-conjugated 4-amino-1,8-naphthalimide (shown at the bottom right corner). The gray spheres indicate the hypothesized coordination of eight lanthanide cations (Eu3+) within the dendrimer nanocomplex (modified dendrimer size approximately 3 nm). (B) 1H-NMR spectrum and peak assignment of G3P4A18N.
2.2. Mobility Determination by Capillary Zone Electrophoresis
The Eu-G3P4A18N dendrimer samples were characterized with electrophoretic analysis by CZE with diode array UV absorbance detection with an Agilent CE system (Agilent Technologies, Palo Alto, CA). A 75.0 μm i.d. unmodified fused silica capillary (Polymicro Technologies, Phoenix, AZ) 34.0 cm in total length, and 8.5 cm to the detector (short end) was employed. The background electrolyte was 40 mM phosphoric acid in 30% DMSO and 70% 18MΩ-cm water at pH of 2.3. Each day prior to use, the capillary was preconditioned with 1 M NaOH for 5 min, 18 MΩ-cm water for 15 min and running buffer for 15 min. The capillary was flushed with running buffer for 2 min in between analysis. A separation potential of 17.0 kV was employed and a co-flow pressure of 10 mbar was also applied during the electrophoresis. Dendrimer samples were at a concentration of 3 mg/mL in DMSO. Hydrodynamic injection (50 mbar, 1.5 sec) was employed, and the capillary was maintained at 25 °C. Detection was performed at 450 nm and 280 nm, and UV-vis spectra were collected in each peak. A small co-flow pressure of 10 mbar during electrophoresis was needed to reliably detect the neutral zone corresponding to the DMSO from the injection plug, and the migration time for this solvent zone was used to calculate the electroosmotic mobility of the system.
2.3. Spectroscopic Characterization of Eu-G3P4A18N
Absorption spectra were recorded on samples in a Perkin-Elmer Lambda 9 BX Spectrometer, coupled with a personal computer using software supplied by Perkin-Elmer (Waltham, MA, USA).
Steady-state emission and excitation spectra were analyzed using a modified Horiba Jobin Yvon Spex Fluorolog-322 Spectrofluorometer, coupled to a personal computer with software supplied by Horiba Jobin Yvon Inc. (Edison, NJ, USA). Emission and excitation spectra were corrected for the instrumental function. Samples were placed in 1 mm quartz fluorescence cells purchased from NSG Precision Cells, Inc. (Farmingdale, NY, USA).
The Eu3+ luminescence lifetime measurements were performed using a Nd:YAG Continuum Powerlite 8010 laser (354 nm, third harmonic) as the excitation source. Emission was collected at a right angle to the excitation beam, and signals arising from the 5D0 → 7F2 Eu3+ transition (615 nm) were selected by a Spectral Products CM 110 1/8 meter monochromator. The signal was monitored using a Hamamatsu R928 photomultiplier coupled to a 500 MHz band pass digital oscilloscope (Tektronix TDS 754D). For each flash, the experimental decay was recorded with a resolution of 50,000 points. To minimize experimental contribution, signals from >1000 flashes were collected and averaged. Luminescence decay curves were analyzed with Origin 7.0 software. The experimental decay curves were fitted to single, double, and triple exponential models using the Chi-squared criteria to discriminate the best exponential fit. Four independent decay curves were collected for the sample.
For the photobleaching experiments, approximately 0.9 mL of each solution (0.2 μM in 30% DMSO/H2O) was transferred into a 0.9 mL semimicro absorbance cuvette supplied by Varian (catalog number 66-100127-00). The cuvette was stoppered and parafilmed at the beginning of each trial to prevent solvent evaporation. Photobleaching was quantified with a Perkin-Elmer UV/Vis, collecting at 240 λ/nm scan rates. Samples were exposed to white light from the Xenon lamp of the Horiba Jobin Yvon Spex Fluorolog-322 Spectrofluorometer in-between scans. A water circulator was used to maintain constant room temperature (23 °C) within the fluorimeter during long periods of exposure.
For the quantum yield experiments, spectra were collected and analyzed using the Horiba Jobin Yvon Spex Fluorolog-322 fitted with an integrating sphere [17] using quartz tubes as sample holders. A 20 μM solution of Eu-G3P4A18N in 30% DMSO/H2O was used for this analysis, and all spectra were corrected for the response of the lamp before integrating. Integrated values were used to determine the quantum yield by calculating the ratio of the photons into the sample to the photons emitted by the sample.
2.4. Animals
Four- to six-week-old male WAG/RijHsd rats were purchased from Harlan, Netherlands. Rats were fed ad libitum and maintained in environments with controlled temperature of 22 – 24 °C and 12 h light and dark cycles. All procedures involving the rats were in accordance with the Guide for the Care and Use of Laboratory Animals (National Research Council, 1996) and on a protocol approved by the Institutional Animal Care and Use Committee of the University of Pittsburgh.
2.5. Generation of colorectal metastasis by single tumor implantation
While others have initiated colorectal metastasis by injecting cancer cells via the portal vein, superior mesenteric vein [18] or spleen [19], these approaches lead to small diffuse lesions, which are difficult to study [20]. We generated the isolated hepatic colorectal metastasis model by way of implanting CC531 tumor pieces into rat livers. Fourteen twenty-to-thirty-week-old WAG/RijHsd rats were anesthetized with a single intraperitoneal injection of 70 mg/kg of Ketamine (Bedford Labs; OH, USA) and 2.5 mg/kg of Acepromazine (Boehringer Ingleheim Vetmedica, Inc.; MO, USA). An intramuscular injection of 0.1 mg/kg of Buprenorphine (Bedford Labs; OH, USA) was also administered for analgesia prior to incision. Following midline incision, CC531 tumor nodules (1 × 2 mm weighing 25 mg) were implanted in the subcapsular area of the left lateral lobe (LLL) of the rat. These implanted tumor nodules were isolated from CC531 tumors grown hepatic implants in WAG/RijHsd rats. The tumors were placed about 5 mm deep to the subcapsular area of the LLL of the liver where it was easily found 20 – 30 days later when the rat underwent a second laparotomy for GDA cannulation and hepatic infusion of the Eu-G3P4A18N solution.
2.6. Cell Culture and generation of colorectal metastasis by splenic injection
CC531 cell line is a moderately differentiated colon adenocarcinoma syngeneic to WAG/RijHsd rats [21]. Tumor cells were tested and found to be virus- and mycoplasma-free. CC531 cells were cultured in Dulbecco’s modified eagle medium (DMEM) (Gibco; Grand Island, NY, USA) supplemented with 10% fetal bovine serum. Cells were maintained by serial passage. Tumor cells were harvested with a solution of 0.25% trypsin (Sigma; St. Louis, MO, USA), washed three times in 0.9% NaCl solution buffered with 1.4 mM phosphate (PBS) and adjusted to a suspension containing 2 × 10⁶ viable (trypan blue exclusion test) tumor cells per 200 μL of PBS, which were then injected into the spleen to generate metastatic tumor nodules in the liver. Metastatic lesions to the liver were revealed 20 – 25 days later after a midline incision was performed.
2.7. Luminescence imaging of hepatic tumors
In vivo administration of the Eu-G3P4A18N (300μL of a 60 μM solution in 10% DMSO/H2O) was captured as it was being infused and selectively associating with the liver tumor. The imaging system used to detect the luminescence of the dendrimer is custom-made, combining either a Andor DU 434-BR-DD cooled charge coupled device (CCD) camera (Andor Technology, South Windsor, Connecticut) or Rolera XR fast digital CCD camera (QImaging; Surrey, Canada) fitted with a 50 mm AF Nikkor lens containing a minimum aperture of F16 and maximum aperture of F1.4. The emission filters used were 610 / 30 nm and a 740 / 140 nm cutoff in wavelength (Chroma Technologies; VT, USA). The rat livers on living animals were excited using four, 5 Watt LEDs, emitting at 450 nm (Lumileds Lighting; CA, USA). Qcapture software (QImaging, Surrey, Canada) was used for the data acquisition.
Luminescence imaging of 10 μm tumor sections following hepatic arterial infusion of functionalized dendrimers was accomplished with an Olympus FV1000MPE multi photon laser-scanning unit fitted to an IX81 microscope (Olympus Corp.; Tokyo, Japan). Illumination for two-photon excitation at 820 nm was provided by a mode-locked Chameleon Ultra Ti:Sapphire laser (Coherent Inc.; Santa Clara, CA, USA). An Olympus 25x objective with N.A. of 1.05 was used to acquire images. Luminescence emission was collected with an external photomultiplier tube using a 570 – 625 nm bandpass filter. Scan resolution was set to 1024 × 1024 pixels at 4096 grey scales.
2.8. Histopathology of liver tumors sections
Tissue sections (10 microns) from dendrimer-infused livers were also processed for routine hematoxylin and eosin (H&E) and immunohistochemistry staining. Tissues were fixed with 2% paraformaldehyde for 2 h at 4 °C, and then left overnight in 30% sucrose at 4 °C. The samples were frozen in a liquid nitrogen-cooled bath of 2-methyl-butane and cryosectioned. Sections were labeled with monoclonal CD31 (ABR MA1-26196) and Alexa Fluor 647 phalloidin (Invitrogen A22287). Goat anti mouse Cy3 secondary antibody for CD31 and DAPI followed. Images were then taken on the Olympus FV1000 confocal microscope.
3. Results
3.1. Functionalized dendrimer with Eu3+
We have designed and synthesized a nanoscale dendrimer complex that achieves site-specificity requirements and tested its use in live animal imaging. The dendrimer provides a versatile organic framework to which multiple fluorophores have been covalently attached. Covalently attaching organic fluorophores to the surface of the dendrimer can drastically improve the stability of the association when compared to occupying the interior cavities and being secured by secondary interactions. As a luminescent moiety, we have chosen 4-amino-1,8-naphthalimide since this molecule is hypothesized to emit a significant amount of photons in the red/near-infrared region of the electromagnetic spectrum. Such emission wavelengths allow for sensitive detection due to the absence of native fluorescence of biological systems in this spectral region (improvement of the signal-to-noise ratio). Higher generation dendrimers have a greater number of terminal branches, which correlates to the number of fluorophores which can be substituted on the surface of each dendrimer, thereby increasing the overall absorptivity and number of emitted photons per unit volume and further improving signal intensity.
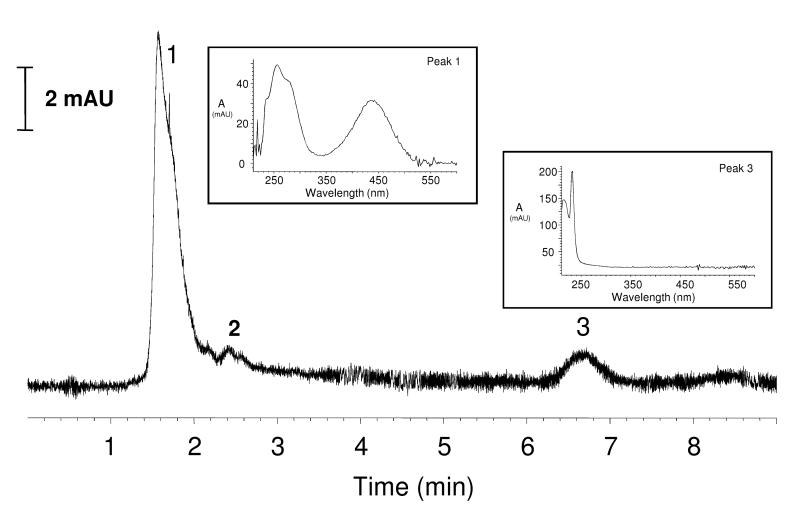
By providing alternate routes of energy transfer with respect to photoreaction, luminescent lanthanide cations such as Eu3+ are hypothesized to partially depopulate the excited state(s) of fluorophores when the donor-acceptor energy levels are sufficiently matched, thereby preventing significant photobleaching from occurring. Poly(amidoamine) dendrimers (PAMAM) contain numerous binding sites along the alternating amide bond architecture of their arms, a requirement for coordinating metal cations [22]. A lanthanide complex was based on a generation-3 PAMAM dendrimer (G3 PAMAM or G3P), capable of coordinating multiple Eu3+ cations within the interior. The thirty-two amino end branches of the generation-3 dendrimer were functionalized with 4-amino-1,8-naphthalimide fluorophores (4A18N) using glycine linkers to yield the functionalized dendrimer: generation-3-PAMAM-(glycine-4-amino-1,8-naphthalimide)32 (G3P4A18N). The complete functionalization of each dendrimer branch was confirmed by 1H-NMR and elemental analysis (see Methods). Eight Eu3+ cations were coordinated within the branches to yield the Eu3+ complex Eu-G3P4A18N by following a procedure that we have previously developed for a dendrimer carrying different fluorophores [16]. CZE analysis of the Eu-G3-PAMAM-(Gly-4-amino-1,8-naphthalimide)32 dendrimer with detection at 450 nm gave rise to one major peak with a cationic electrophoretic mobility of 1.39 × 10⁻⁴ cm2/V s (Fig. 2). A minor component present in some samples represented no more than 7% by peak area and had a mobility of about 6.8 × 10⁻⁵ cm2/V s. The UV-vis spectrum obtained from the major peak is consistent with the expected spectrum for the dendrimer. These data are consistent with a well-defined species not showing any significant dispersity. The chemical structure of Eu-G3P4A18N is depicted in Fig. 1A. Substitution of end branches is designated by “R”, defined in the lower right corner with glycine-conjugated 4A18N. The gray spheres indicate the hypothesized coordination of the lanthanide, Eu3+, within the dendrimer nanocomplex.
Fig. 2.
Electropherogram of Eu-G3P4A18N. Electropherogram obtained at 450 nm upon CZE analysis of 3 mg/mL (in DMSO) sample of Eu-G3P4A18N. Key: 1. Dendrimer, 2. impurity, 3. DMSO solvent zone (to mark flow). Insets: UV-VIS spectra collected from peaks 1 and 3. Separation conditions listed in experimental section.
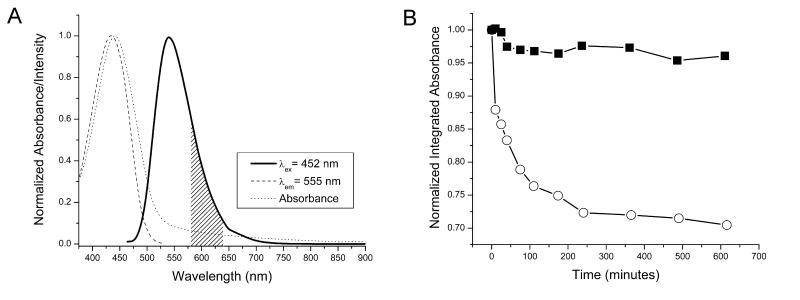
The absorption spectrum indicates an apparent maximum at approximately 440 nm; however, it is worth noting that the compound does absorb significantly at longer wavelengths. The molar extinction coefficient is 5,000 cm−1mol−1L at 630 nm, which is almost two times greater than that of Photofrin at the same wavelength [23]. Absorption at longer wavelengths is attractive for biological imaging since photons at these wavelengths generate very little autofluorescence and since such photons are not harmful for biological systems, preventing any perturbation of the system to be monitored. The luminescence emission spectrum indicates the presence of a prominent broad band with a significant component in the red/NIR part of the electromagnetic spectrum (Fig. 3A, solid line). The collection of luminescence lifetime measurements arising from Eu3+-centered emission was made possible with the help of the spectroscopic resolution of a laser exciting at 354 nm. A monoexponential decay of 1.09 (± 0.03) ms was fitted best from the experimental decay curve. This value is in good agreement with comparable systems [16] and provides good evidence that each of the eight Eu3+ cations located within the dendrimer are both well protected and feel a similar coordination environment inside the dendritic architecture. The similar coordination environment around each of the lanthanide cation is a strong indication that only one well defined species is formed in solution. Polydispersity would result in several luminescence lifetimes as these cations are highly sensitive to their environment. The quantum yield of the compound upon excitation at 450 nm is 2.9 (±0.1)%. This value is relatively low, but the overall sensitivity provided by the imaging agent will be related to the number of emitted photons per unit of volume and, in this case, the small quantum yield will be compensated by the high density of luminescent 4-amino-1,8-naphthalimide groups.
Fig. 3.
Emission spectra and photobleaching analysis of Eu-G3P4A18N used in luminescence imaging. (A) The luminescence emission spectrum displays a prominent band with an intensity maximum at 550 nm and a tail extending into the red/NIR part of the spectrum (solid line). The shaded area of the emission spectrum indicates the luminescence signal detected during the confocal microscopy experiments. A steady-state excitation spectrum (dashed line), collected upon monitoring the maximum intensity of the luminescence band (555 nm), overlaps significantly with the absorption spectrum (dotted line). (B) The absorbance of G3P4A18N was monitored as a function of time upon exposure to white light. In the absence of Eu3+ (open circle), the absorption decreased exponentially for the duration of the experiment, leading to an overall decrease approaching 30%. The trend observed in the presence of Eu3+ (filled square) was a modest decrease in absorbance during the first minutes, followed by an impressive level of stability for the same duration.
When specific conditions are met, the electronic structures of lanthanide cations are hypothesized [14] to stabilize the excited states of organic fluorophores against photobleaching. To analyze this hypothesis, the absorbance from the 1,8-naphthalimide derivative was monitored as a function of time upon exposure to white excitation light (Fig. 3B). In the absence of Eu3+, the absorbance of G3P4A18N decreased exponentially. This behavior indicates that the fluorophores are vulnerable to photobleaching. In the presence of Eu3+, the absorbance of Eu-G3P4A18N experienced a modest decrease within the first hour of exposure to white light; however, the absorbance maintained constant values for the remainder of the experiment. Indeed, the exciting side-by-side comparison depicted in Fig. 3B lends an evidence to the idea that the eight Eu3+ provide increased stabilization to the electronic structure of the thirty-two 4-amino-1,8-naphthalimide fluorophores (singlet and triplet states). This feature is advantageous for applications, allowing for an extended shelf life, longer exposure time to excitation light, and repeatability of experiments. Such stabilization for a molecular complex in solution has been, to the best of our knowledge, only reported in one article [14].
We will analyze more deeply this exciting phenomenon in order to obtain control of it. We will test the different luminescent lanthanide cations to identify the one that is the most efficient. These future experiments will be useful for elucidating the underlying mechanism of chromophore stabilization.
3.2. Hepatic arterial infusion of Eu-G3P4A18N
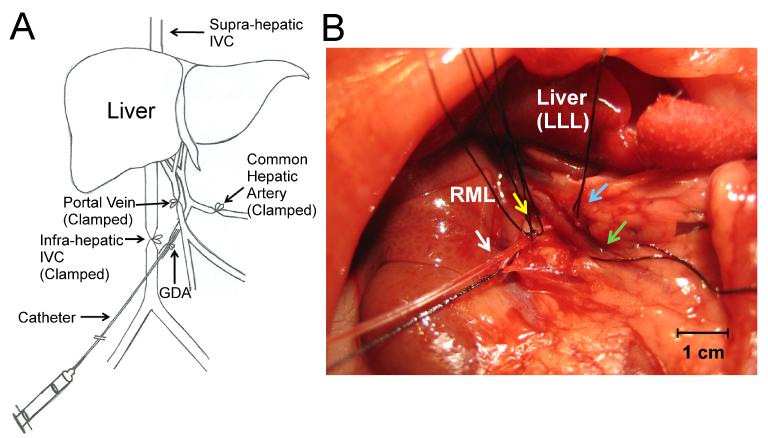
Regional hepatic delivery of Eu-G3P4A18N was made possible by infusion via the gastroduodenal artery (GDA) of 160 – 330 gm WAG/RijHsd rats. This technique involves isolation of the vasculature of the liver by clamping closed the common hepatic artery, portal vein and infra-hepatic inferior vena cava (Fig. 4A). A polyethylene 10 (PE-10) catheter was inserted retrograde into the GDA for a length of approximately 4 mm and secured with two 6-0 silk sutures (Fig. 4B). Infusion of 7 mL of 100 units/mL of heparinized normal saline was made into the GDA of a live WAG/RijHsd rat to temporarily evacuate the hepatic blood volume prior to delivery of the functionalized dendrimer complex. To demonstrate its preferential accumulation in tumors, Eu-G3P4A18N (0.8 μg/g total body weight) was infused through the GDA followed by 5 mL of normal saline to ensure full distribution of the dendrimer into the liver. The liver was excised following infusion to evaluate the luminescence signal emitted by the Eu-G3P4A18N in the tumor and the background liver parenchyma.
Fig. 4.
Cannulation of the gastroduodenal artery (GDA). (A) Diagram of the GDA cannulation illustrating isolation of the liver with clamping of the major vessels: portal vein, infra-hepatic inferior vena cava, and the common hepatic artery. The cannulation is indicated by a syringe and catheter leading into the site of the GDA. (B) A 1 mm polyethylene catheter was inserted into the GDA (white arrow) and then secured with two 6-0 silk ties (yellow arrow). The hepatic artery was isolated with a silk tie (blue arrow). The portal vein was also isolated using a silk tie (green arrow). The liver is shown above with the dome of the left lateral lobe (LLL) reflected at the top of the photo and the right medial lobe (RML) immediately to the left of the LLL. Liver is being shown in the anterior to posterior view.
3.3. Ex vivo imaging of Eu-G3P4A18N infusion
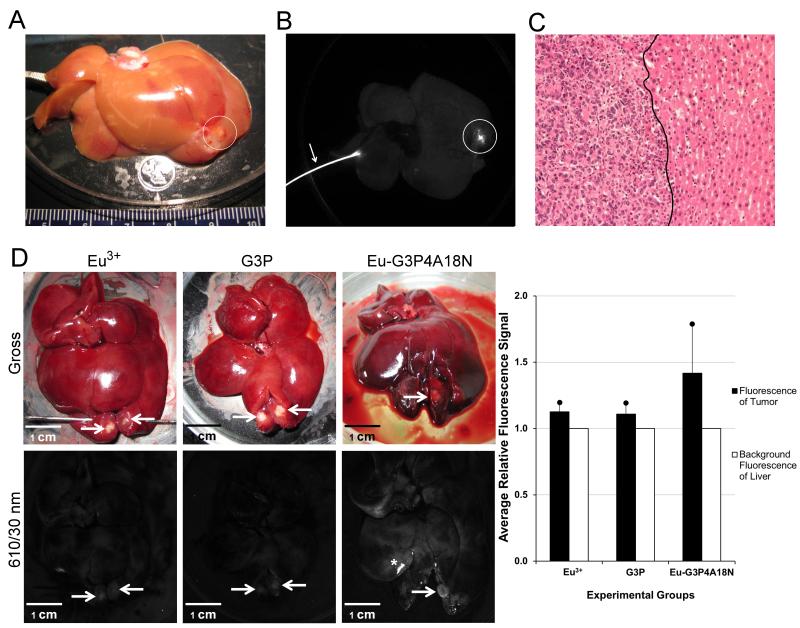
Imaging of ex vivo rat livers demonstrated that high-intensity luminescence was evident in the tumors only seconds following an ex vivo Eu-G3P4A18N infusion (Fig. 5A, B) when observing emission signal at 610 nm and 740 nm. Although there were some minor uptakes by the non-tumorous portion of the liver, these background signals were negligible in the red/NIR range of imaging. In animals with extra-hepatic intra-abdominal tumor deposits, no luminescence was observed in these tissues (data not shown). To confirm that Eu-G3P4A18N enhancement is occurring specifically in the tumor tissues, histological evaluation of the luminescent foci demonstrated that they were adenocarcinomas (Fig. 5C).
Fig. 5.
A cannulated ex vivo liver infused with Eu3+, G3P or Eu-G3P4A18N with luminescence imaging and analysis. (A) White light image of an ex vivo liver with an established tumor implant. The white circle indicates the location of the tumor within the liver. (B) Luminescence image of liver after Eu-G3P4A18N infusion with an excitation wavelength of 450 nm and emission filter of 610 nm with a 30 nm bandpass. The circle shows the luminescence emitted by the tumor area only seconds after infusion of Eu-G3P4A18N. (C) 20x, H&E stained section of the tumor from the same liver showing the transition zone between adenocarcinoma on the left and normal liver parenchyma on the right of the solid black line. (D) Gross photographs (top row) and luminescence images (bottom row) of the livers containing tumors (arrows) that were implanted 20 – 30 days prior to infusion and excised at 0 h time point. Images are from liver infused with Eu3+ only (first column), G3P (non-functionalized dendrimer without Eu3+; second column) or Eu-G3P4A18N (third column). Average tumor luminescence was corrected for background autofluorescence in the resulting graph. Asterisks represent specular reflection of the liver. Scale bars represent 1 cm.
To verify that only Eu-G3P4A18N has the capacity labeling tumors in the liver, rat livers were infused in vivo with Eu3+ cations only, dendrimers without Eu3+ and naphthalimide (G3P), or Eu-G3P4A18N. Fig. 5D demonstrates the gross and luminescence images of the livers infused with the three different molecules or cations. The Eu3+-only infusion and the dendrimer-only infusion both show minimal or no luminescence arising from the tumor when compared to the tissue autofluorescence. However, intrahepatic Eu-G3P4A18N infusion demonstrated specific higher-intensity luminescence in the tumor. These data are represented quantitatively in Fig. 5D.
3.4. Multiple tumor imaging with Eu-G3P4A18N
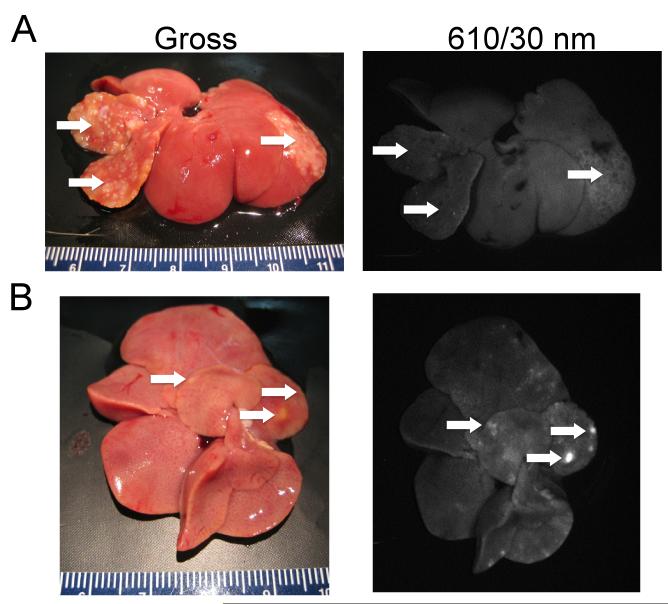
Multiple metastatic tumor nodules were generated in a rat liver via a splenic injection of CC531 colorectal cancer cells. After infusion of Eu-G3P4A18N, the rat liver was excised and imaged by luminescence. Fig. 6A shows the gross and corresponding luminescence photographs of an ex vivo liver. This liver was used as a control and was not infused with the dendrimer complex to demonstrate that the metastatic tumor nodules themselves have minimal native fluorescence within the spectral region of detection (595 to 625 nm). Fig. 6B presents the gross and corresponding luminescence photographs of another ex vivo rat liver with metastatic lesions. The metastatic nodules display a more intense luminescence signal than the background after infusion of Eu-G3P4A18N.
Fig. 6.
Colorectal metastasis to the liver (A) without and (B) with infusion of Eu-G3P4A18N. (A) Arrows show tumor nodules in the liver of a rat generated after a splenic injection of CC531 tumor cells. No dendrimer was infused into this liver. The second image shows the absence of luminescence in the nodules. (B) Arrows show metastatic lesions in another liver of a rat from a splenic injection of CC531 tumor cells. The liver was infused with Eu-G3P4A18N (300 μL of a 60 μM solution in 10%DMSO/H2O). Luminescence image were taken with a CCD camera (excitation light of 450 nm and emission filter of 610 nm with a 30 nm bandpass filter).
3.5. Retention time of the Eu-G3P4A18N in tumors
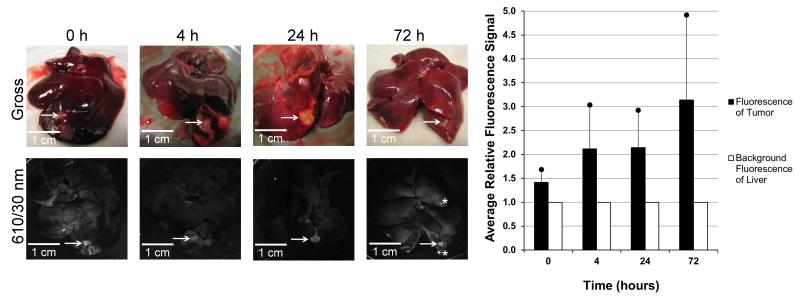
To determine the retention time of the dendrimer in the tumor post infusion, rats were injected intrahepatically with Eu-G3P4A18N and sacrificed at the following time points: 0 h, 4 h, 24 h, and 72 h (Fig. 7). Sustained luminescence signals from the tumors were observed at all time points post infusion. Background autofluorescence of the liver was accounted for and the resulting bar graph (Fig. 7) demonstrates quantitatively that signals from the tumors were present up to 72 h post injection.
Fig. 7.
Gross and luminescent photographs of tumors in the livers of rats with analysis of the tumor luminescence. Gross (top row) and luminescent (bottom row) images of the livers containing tumors (arrows) that were implanted 20 – 30 days prior to infusion and excised at 0 h, 4 h, 24 h and 72 h time points after hepatic infusion with Eu-G3P4A18N. Average signals obtained from the tumors were compared to that of tissue autofluorescence and displayed in the resulting graph. Asterisks represent specular reflection. Scale bars represent 1 cm.
3.6. In vivo imaging of Eu-G3P4A18N infusion
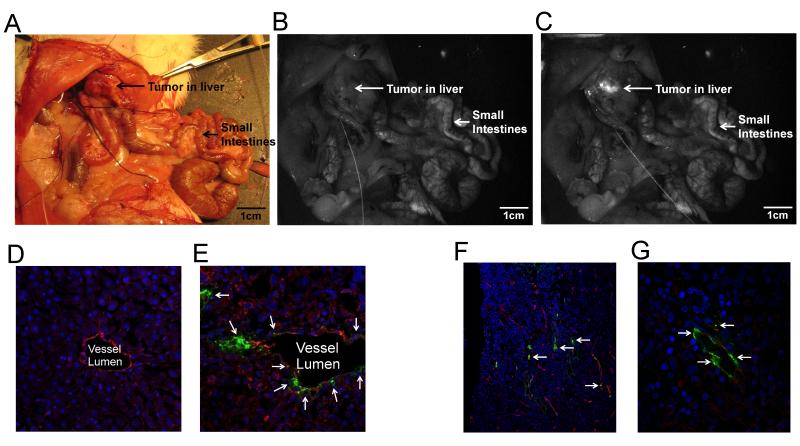
To evaluate the preferential accumulation in tumors of our functionalized dendrimer in vivo, in vivo intrahepatic infusion of Eu-G3P4A18N in anesthetized rats (Fig. 8A-C) was performed. Localized luminescence was observed in the tumor tissues within seconds following infusion. This result is consistent with our previous observations in the ex vivo setting. The infused liver was excised and sectioned for red/NIR microscopy. We found that the signal-to-noise ratio was improved when luminescence was detected at 740 nm/140 nm (image not shown) as compared to 610/30 nm.
Fig. 8.
In vivo colorectal hepatic tumor localization after the infusion of Eu-G3P4A18N and histological imaging using confocal and multi-photon scanning microscopy. (A) White light photograph of an in vivo rat liver containing a tumor; Luminescent images of the abdominal cavity of the rat before (B) and after (C) Eu-G3P4A18N infusion (excitation 450 nm and emission filter of 610 nm with a 30 nm bandpass). (D) 20x confocal microscopic image of a section of liver without the tumor after Eu-G3P4A18N infusion, no luminescence of the dendrimer is seen. The excitation wavelength was 488 nm and emission wavelength was 567 nm. Vessels are labeled with CD-31 (red), nuclei of hepatocytes with dapi (blue) and dendrimer (green). (E) Eu-G3P4A18N can be seen in green (arrows) with the 40x magnification of a confocal microscopic image of tumor in the liver after infusion. The same colored labels are used. (F) 25x magnification of a tumor section in a rat liver after infusion of Eu-G3P4A18N. The two-photon excitation was 820 nm and the luminescence emission was 570 – 625 nm. The nuclei of cancer cells are seen in blue, the aberrant vessels are depicted in red and the dendrimer is designated in green (arrows) to show the association of Eu-G3P4A18N with the tumor vasculature seen in red. (G) 60x magnification of another section of tumor within the same liver also demonstrating the same concept.
Use of a two-photon excitation scanning confocal microscope allowed us to confirm that the luminescence signal of the dendrimer was present within the vasculature of the liver (Fig. 8D). Higher magnifications of the tissue sections revealed that the luminescence is located outside of the vessels in the perivascular space (Fig. 8E). Fig. 8F-G also show a section of tumor from a rat liver that was infused with Eu-G3P4A18N displaying the same association of the dendrimer with the vasculature under confocal microscopy. Tumor vasculature is disorganized and displays widened inter-endothelial junctions and fenestrae that range from 400 – 800 nm in size [24]. Thus, tumor vasculature is often described as “leaky”, allowing for larger molecules to extravasate the vascular endothelium into the extravascular space and in the process bypass normal liver parenchyma. The relatively small size of our dendrimer [25] facilitates its exit through the fenestrae and allows it to be trapped in the extravascular spaces of the tumor. The confocal microscopy observations are consistent with the hypothesis that Eu-G3P4A18N has increased extravasation from the leaky tumor vasculature and, therefore, is more likely to be trapped in the perivascular spaces of the tumor.
4. Discussion
We have designed and synthesized a luminescent marker based on a generation-3 dendrimer covalently substituted with thirty-two luminescent 4-amino-1,8-naphthalimide groups via glycine linkers, and complexed with eight equivalents of trivalent europium cations (Eu-G3P4A18N). The large number of luminescent groups results in more sensitive detection due to the large number of fluorophores per unit volume. Lanthanide cations coordinated within the dendrimer branches allow for stabilization of the fluorophores against photobleaching and result in a robust luminescent marker. These unique properties make real-time luminescence imaging of hepatic tumors in the WAG/Rij Hsd rat model possible. We have observed that the luminescence located in the tumor was visible within seconds following hepatic arterial infusion of the dendrimer. This rapid visualization compares favorably with other fluorescent agents, such as pH sensitive fluorescent markers [26], of which the incorporation may take hours in order to achieve observable fluorescence, or green fluorescent proteins (GFPs) and luciferase-based strategies, where there is also limited control over timing of genetic expression. In addition, luciferase-based strategies require tumor cells to express this gene prior to inducing tumors, a method that is not compatible with clinical studies. Moreover, small molecule fluorophores such as fluorescein and cyanine dyes tend to photobleach rapidly, thus limiting their usefulness in the diagnostic setting.
Our modified dendrimers, estimated to be approximately 3 nm in diameter [25], are significantly smaller than the 100 nm and 300 nm sized nanoparticles used in other tumor detection studies [27], minimizing disturbance of the biological system to be observed. Size-specificity is advantageous for improved distribution, thereby maximizing potential tumor tissue penetration and preferential accumulation [28]. In our proposed metastatic tumor model, we have demonstrated our ability to unambiguously detect the presence of a tumor within seconds post-infusion and up to 72 h in vivo within the liver tumor tissue. The enhanced viability of the luminescent dendrimer complex localized within tumor tissue avails the strategy to multiple potential clinical applications in both imaging and therapeutic settings. As demonstrated in this study, by utilizing the nanoscale size and photophysical stability of the Eu3+ dendrimer complex, we were able to preferentially accumulate within and image tumor tissue in our rat hepatic metastasis model with near-infrared imaging.
Peptide molecules, such as the RGD peptide [29, 30], and tumor-specific antibodies have been demonstrated to have tumor targeting specificity [31-33]. The attachment of such peptide and antibody entities to the dendrimer complex described in this report is anticipated to further improve preferential accumulation within tumors. The versatility of our functionalized dendrimer platform allows us to adapt this preferentially-accumulating system to address a wide array of biological questions. For example, coordination of a radionuclide such as yttrium-90 by our dendrimer should allow for targeted delivery of radiotherapeutic agents to the interior of tumors. The many opportunities which exist for modifying the dendrimer platform will lead to a broad field of applications in detecting and monitoring biological events.
5. Conclusions
We have created a europium-cored generation-3 PAMAM naphthalimide dendrimers. These dendrimers are strongly resistant to photobleaching and preferentially accumulate within liver tumors after hepatic artery infusion. These results suggest that the dendrimer complex has great potential to serve as imaging agent to detect metastatic sites during regional therapy.
Acknowledgements
We thank Per Basse, M.D., Ph.D., DMSci for making available the CC531 colorectal cancer cells. We would like to thank Guang Jin, M.D., Ph.D., Congrong Ma, Katie Lyn Leschak, VT, BA and Diane Mazzei, LAT for their contribution and assistance with in vitro and animal experiments. We would also like to thank Byron Ballou, Ph.D. and Simon C. Watkins, Ph.D. for their contributions in the biological imaging sciences.
The original studies in the authors’ laboratories were funded in part by grants from the David C. Koch Therapy Cancer Center, the National Institute of Health T32 CA113263 “Postdoctoral Research Training in Biotherapy of Cancer” grant and CA140554 (Lee), as well as 1R21CA120579 (Modzelewski), 1R21CA133553 (Petoud) and a grant from the Hillman Foundation. S.P. thanks “La Ligue contre le Cancer”, Institut National de la Santé et de la Recherche Médicale (INSERM)for financial support in France. The work in France was carried out within the European COST action D38.
Abbreviations used
- CCD
charged coupled device
- CE
Capillary electrophoresis
- CRC
colorectal cancer
- CZE
capillary zone electrophoresis
- DAPI
4′-6-Diamidino-2-phenylindole
- DIPEA
Diisopropylethylamine
- DMEM
Dulbecco’s modified eagle medium
- DMF
N,N-Dimethylformamide
- DMSO
Dimethyl sulfoxide
- Eu-G3P4A18N
generation-3 PAMAM 4-amino-1,8-naphthalimide dendrimer contains europium ions
- GDA
gastroduodenal artery
- GFP
green fluorescence protein
- HATU
2-(1H-7-Azabenzotriazol-1-yl)-1,1,3,3-tetramethyl uronium hexafluorophosphate methanaminium
- H & E
hematoxylin and eosin
- 1H-NMR
proton nuclear magnetic resonance
- LED
light-emitting diode
- LLL
left lateral lobe
- MWCO
molecular-weight cutoff
- PAMAM
poly(aminoamine)
- PBS
phosphate buffered saline
- RML
right medial lobe
- TACE
transaterial chemoembolization
- TLC
thin-layer chromatography
- UV
ultraviolet
- Vis
visible
Footnotes
Publisher's Disclaimer: This is a PDF file of an unedited manuscript that has been accepted for publication. As a service to our customers we are providing this early version of the manuscript. The manuscript will undergo copyediting, typesetting, and review of the resulting proof before it is published in its final citable form. Please note that during the production process errors may be discovered which could affect the content, and all legal disclaimers that apply to the journal pertain.
S. Petoud, C. K. Brown and Y.J. Lee share primary corresponding authorship.
References
- [1].Jemal A, Siegel R, Ward E, Hao Y, Xu J, Murray T, et al. Cancer statistics, 2008. CA Cancer J Clin. 2008;58:71–96. doi: 10.3322/CA.2007.0010. [DOI] [PubMed] [Google Scholar]
- [2].Park JO, Brown CK. Colorectal cancer. In: Brown CK, Rini BI, Connell PP, Posner MC, editors. Holland - Frei manual of cancer medicine. BC Decker Inc; Hamilton: 2005. pp. 184–204. [Google Scholar]
- [3].Abdalla EK, Vauthey J-N, Ellis LM, Ellis V, Pollock R, Broglio KR, et al. Recurrence and outcomes following hepatic resection, radiofrequency ablation, and combined resection/ablation for colorectal liver metastases. Ann Surg. 2004;239:818–27. doi: 10.1097/01.sla.0000128305.90650.71. [DOI] [PMC free article] [PubMed] [Google Scholar]
- [4].Fiorentini G, Aliberti C, Benea G, Montagnani F, Mambrini A, Ballardini PL, et al. TACE of liver metastases from colorectal cancer adopting irinotecan-eluting beads: beneficial effect of palliative intra-arterial lidocaine and post-procedure supportive therapy on the control of side effects. Hepatogastroenterology. 2008;55:2077–82. [PubMed] [Google Scholar]
- [5].Bartlett DL, Libutti SK, Figg WD, Fraker DL, Alexander HR. Isolated hepatic perfusion for unresectable hepatic metastases from colorectal cancer. Surgery. 2001;129:176–87. doi: 10.1067/msy.2001.110365. [DOI] [PubMed] [Google Scholar]
- [6].Agarwal A, Asthana A, Gupta U, Jain NK. Tumour and dendrimers: a review on drug delivery aspects. J Pharm Pharmacol. 2008;60:671–88. doi: 10.1211/jpp.60.6.0001. [DOI] [PubMed] [Google Scholar]
- [7].Medina SH, El-Sayed MEH. Dendrimers as carriers for delivery of chemotherapeutic agents. Chem Rev. 2009;109:3141–57. doi: 10.1021/cr900174j. [DOI] [PubMed] [Google Scholar]
- [8].Tekade RK, Kumar PV, Jain NK. Dendrimers in oncology: an expanding horizon. Chem Rev. 2008;109:49–87. doi: 10.1021/cr068212n. [DOI] [PubMed] [Google Scholar]
- [9].Majoros IJ, Myc A, Thomas T, Mehta CB, Baker JR., Jr. PAMAM dendrimer-based multifunctional conjugate for cancer therapy: synthesis, characterization, and functionality. Biomacromolecules. 2006;7:572–9. doi: 10.1021/bm0506142. [DOI] [PubMed] [Google Scholar]
- [10].Wolinsky JB, Grinstaff MW. Therapeutic and diagnostic applications of dendrimers for cancer treatment. Adv Drug Del Rev. 2008;60:1037–55. doi: 10.1016/j.addr.2008.02.012. [DOI] [PubMed] [Google Scholar]
- [11].Kaminskas LM, Kelly BD, McLeod VM, Boyd BJ, Krippner GY, Williams ED, et al. Pharmacokinetics and tumor disposition of PEGylated, methotrexate conjugated poly-L-lysine dendrimers. Mol Pharm. 2009;6:1190–204. doi: 10.1021/mp900049a. [DOI] [PubMed] [Google Scholar]
- [12].Stiriba S-E, Frey H, Haag R. Dendritic polymers in biomedical applications: from potential to clinical use in diagnostics and therapy. Angew Chem Int Ed. 2002;41:1329–34. doi: 10.1002/1521-3773(20020415)41:8<1329::aid-anie1329>3.0.co;2-p. [DOI] [PubMed] [Google Scholar]
- [13].Dykes GM. Dendrimers: a review of their appeal and applications. J Chem Technol Biotechnol. 2001;76:903–18. [Google Scholar]
- [14].Nockemann P, Beurer E, Driesen K, Van Deun R, Van Hecke K, Van Meervelt L, et al. Photostability of a highly luminescent europium β-diketonate complex in imidazolium ionic liquids. Chem Commun. 2005:4354–6. doi: 10.1039/b506915g. [DOI] [PubMed] [Google Scholar]
- [15].Yuan D, Brown RG, Hepworth JD, Alexiou MS, Tyman JHP. The synthesis and fluorescence of novel N-substituted-1,8-naphthylimides. J Heterocycl Chem. 2008;45:397–404. [Google Scholar]
- [16].Cross JP, Lauz M, Badger PD, Petoud S. Polymetallic lanthanide complexes with PAMAM-naphthalimide dendritic ligands: luminescent lanthanide complexes formed in solution. J Am Chem Soc. 2004;126:16278–9. doi: 10.1021/ja045706y. [DOI] [PubMed] [Google Scholar]
- [17].Aebischer A, Gumy F, Bunzli J-CG. Intrinsic quantum yields and radiative lifetimes of lanthanide tris(dipicolinates) PCCP. 2009;11:1346–53. doi: 10.1039/b816131c. [DOI] [PubMed] [Google Scholar]
- [18].Wittmer A, Khazaie K, Berger MR. Quantitative detection of lac-Z-transfected CC531 colon carcinoma cells in an orthotopic rat liver metastasis model. Clin Exp Metastasis. 1999;17:369–76. doi: 10.1023/a:1006643831825. [DOI] [PubMed] [Google Scholar]
- [19].Bouvet M, Tsuji K, Yang M, Jiang P, Moossa AR, Hoffman RM. In vivo color-coded imaging of the interaction of colon cancer cells and splenocytes in the formation of liver metastases. Cancer Res. 2006;66:11293–7. doi: 10.1158/0008-5472.CAN-06-2662. [DOI] [PubMed] [Google Scholar]
- [20].Kollmar O, Schilling MK, Menger MD. Experimental liver metastasis: standards for local cell implantation to study isolated tumor growth in mice. Clin Exp Metastasis. 2004;21:453–60. doi: 10.1007/s10585-004-2696-3. [DOI] [PubMed] [Google Scholar]
- [21].Hagenaars M, Ensink NG, Basse PH, Hokland M, Nannmark U, Eggermont AMM, et al. The microscopic anatomy of experimental rat CC531 colon tumour metastases: consequences for immunotherapy? Clin Exp Metastasis. 2000;18:189–96. doi: 10.1023/a:1006774602360. [DOI] [PubMed] [Google Scholar]
- [22].Imaoka T, Horiguchi H, Yamamoto K. Metal assembly in novel dendrimers with porphyrin cores. J Am Chem Soc. 2003;125:340–1. doi: 10.1021/ja0285060. [DOI] [PubMed] [Google Scholar]
- [23].Dougherty TJ. Photosensitizers: therapy and detection of malignant tumors. Photochem Photobiol. 1987;45:879–89. doi: 10.1111/j.1751-1097.1987.tb07898.x. [DOI] [PubMed] [Google Scholar]
- [24].Svenson S, Tomalia DA. Dendrimers in biomedical applications-reflections on the field. Adv Drug Del Rev. 2005;57:2106–29. doi: 10.1016/j.addr.2005.09.018. [DOI] [PubMed] [Google Scholar]
- [25].Maiti PK, Çagin T, Wang G, Goddard WA., III Structure of PAMAM dendrimers: generations 1 through 11. Macromolecules. 2004;37:6236–54. [Google Scholar]
- [26].Urano Y, Asanuma D, Hama Y, Koyama Y, Barrett T, Kamiya M, et al. Selective molecular imaging of viable cancer cells with pH-activatable fluorescence probes. Nat Med. 2008;15:104–9. doi: 10.1038/nm.1854. [DOI] [PMC free article] [PubMed] [Google Scholar]
- [27].Liu P, Zhang A, Zhou M, Xu Y, Xu LX. Real time 3D detection of nanoparticle liposomes extravasation using laser confocal microscopy. Engineering in Medicine and Biology Society, 2004 IEMBS ‘04 26th Annual International Conference of the IEEE; 2004. pp. 2662–5. [DOI] [PubMed] [Google Scholar]
- [28].di Tomaso E, Capen D, Haskell A, Hart J, Logie JJ, Jain RK, et al. Mosaic tumor vessels: cellular basis and ultrastructure of focal regions lacking endothelial cell markers. Cancer Res. 2005;65:5740–9. doi: 10.1158/0008-5472.CAN-04-4552. [DOI] [PubMed] [Google Scholar]
- [29].Weller GER, Wong MKK, Modzelewski RA, Lu E, Klibanov AL, Wagner WR, et al. Ultrasonic imaging of tumor angiogenesis using contrast microbubbles targeted via the tumor-binding peptide arginine-arginine-leucine. Cancer Res. 2005;65:533–9. [PubMed] [Google Scholar]
- [30].Dunehoo AL, Anderson M, Majumdar S, Kobayashi N, Berkland C, Siahaan TJ. Cell adhesion molecules for targeted drug delivery. J Pharm Sci. 2006;95:1856–72. doi: 10.1002/jps.20676. [DOI] [PubMed] [Google Scholar]
- [31].Brown CK, Modzelewski RA, Johnson CS, Wong MK. A novel approach for the identification of unique tumor vasculature binding peptides using an E. coli peptide display library. Ann Surg Oncol. 2000;7:743–9. doi: 10.1007/s10434-000-0743-0. [DOI] [PubMed] [Google Scholar]
- [32].Ruoslahti E. Drug targeting to specific vascular sites. Drug Discov Today. 2002;7:1138–43. doi: 10.1016/s1359-6446(02)02501-1. [DOI] [PubMed] [Google Scholar]
- [33].Ruoslahti E, Bhatia SN, Sailor MJ. Targeting of drugs and nanoparticles to tumors. J Cell Biol. 2010;188:759–68. doi: 10.1083/jcb.200910104. [DOI] [PMC free article] [PubMed] [Google Scholar]


