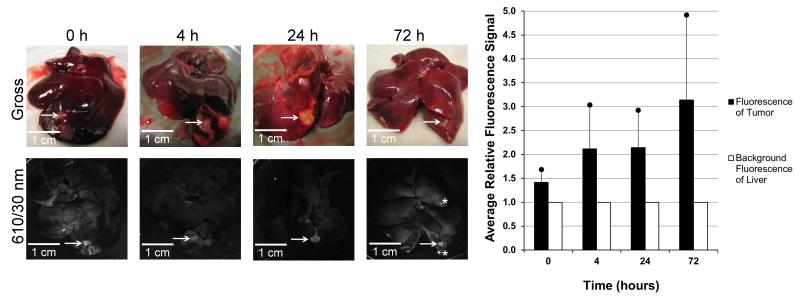
Fig. 7.
Gross and luminescent photographs of tumors in the livers of rats with analysis of the tumor luminescence. Gross (top row) and luminescent (bottom row) images of the livers containing tumors (arrows) that were implanted 20 – 30 days prior to infusion and excised at 0 h, 4 h, 24 h and 72 h time points after hepatic infusion with Eu-G3P4A18N. Average signals obtained from the tumors were compared to that of tissue autofluorescence and displayed in the resulting graph. Asterisks represent specular reflection. Scale bars represent 1 cm.

