Fig. 8.
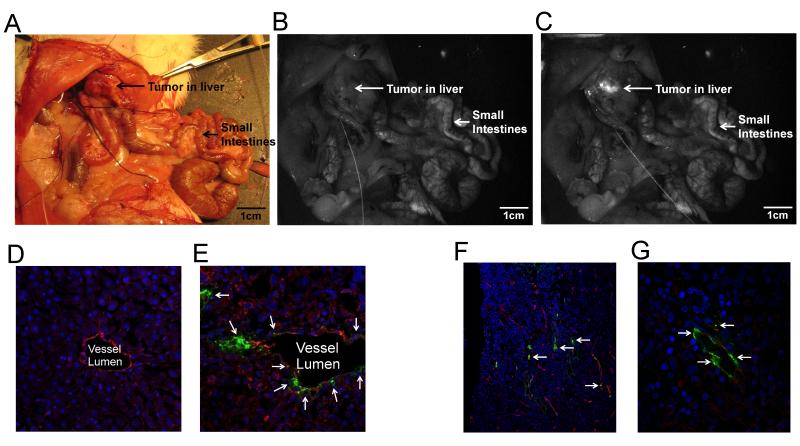
In vivo colorectal hepatic tumor localization after the infusion of Eu-G3P4A18N and histological imaging using confocal and multi-photon scanning microscopy. (A) White light photograph of an in vivo rat liver containing a tumor; Luminescent images of the abdominal cavity of the rat before (B) and after (C) Eu-G3P4A18N infusion (excitation 450 nm and emission filter of 610 nm with a 30 nm bandpass). (D) 20x confocal microscopic image of a section of liver without the tumor after Eu-G3P4A18N infusion, no luminescence of the dendrimer is seen. The excitation wavelength was 488 nm and emission wavelength was 567 nm. Vessels are labeled with CD-31 (red), nuclei of hepatocytes with dapi (blue) and dendrimer (green). (E) Eu-G3P4A18N can be seen in green (arrows) with the 40x magnification of a confocal microscopic image of tumor in the liver after infusion. The same colored labels are used. (F) 25x magnification of a tumor section in a rat liver after infusion of Eu-G3P4A18N. The two-photon excitation was 820 nm and the luminescence emission was 570 – 625 nm. The nuclei of cancer cells are seen in blue, the aberrant vessels are depicted in red and the dendrimer is designated in green (arrows) to show the association of Eu-G3P4A18N with the tumor vasculature seen in red. (G) 60x magnification of another section of tumor within the same liver also demonstrating the same concept.

