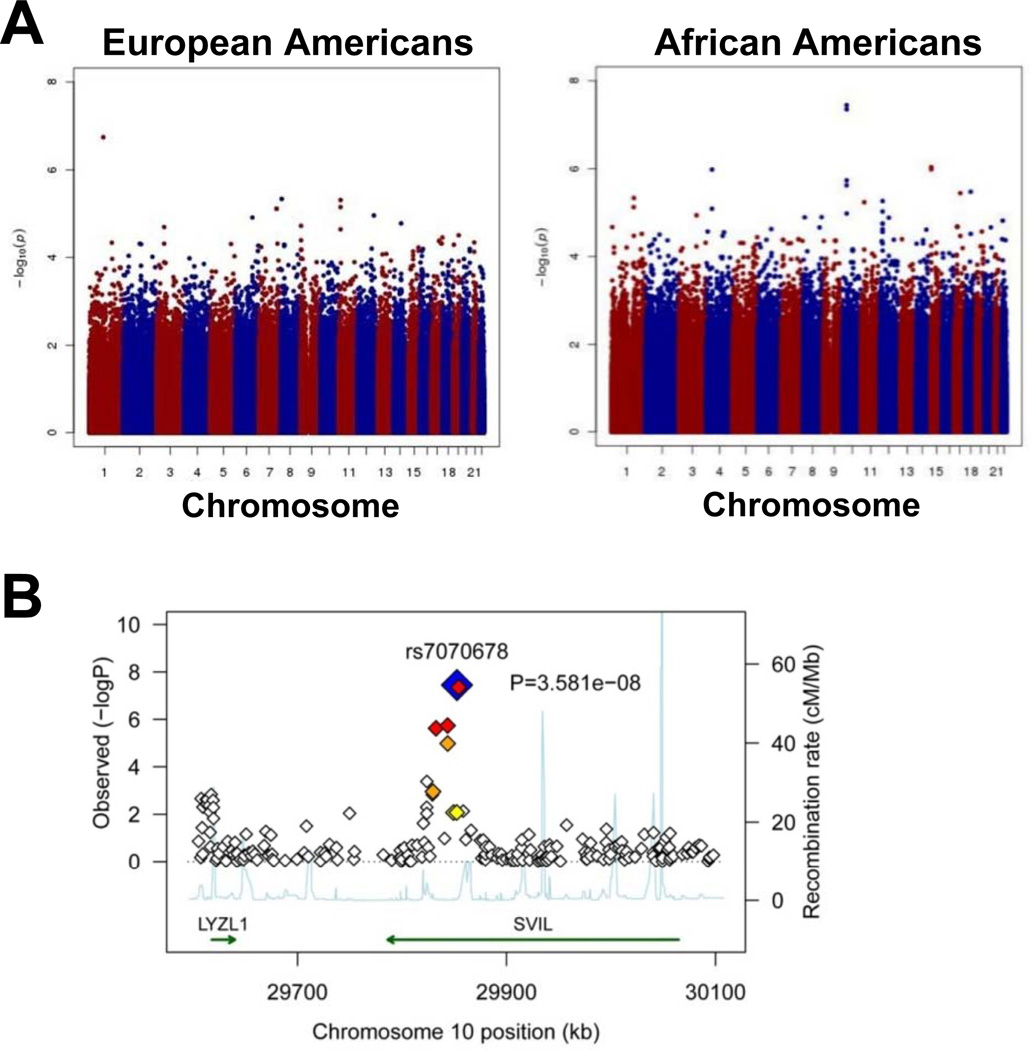
Figure 1.
GWAS with PFA-100ColA. (A) Manhattan Plots for PFA-100ColA. The Manhattan plot is shown for all autosomes for European and African Americans. The y-axis shows the –log10 of the p-values for the chromosomes numbered on the x-axis. For the African Americans the two most significant SNPs are rs7070678 and rs10826650 in SVIL; both meet genome-wide significance with p-values of 3.6x10⁻⁸ and 4.4x10⁻⁸, respectively. None of the SNPs within SVIL meet genome-wide significance for European Americans. (B) SVIL region association plot on chromosome 10 for African Americans. The most significant SNP rs7070678 is displayed, and the amount of linkage disequilibrium between this SNP and nearby SNPs is shown as a heat plot with SNPs in strongest LD with rs7070678 in darker colors. The significance level is displayed on the y-axis as –log 10 of the p-values. The rate of recombination within the region is shown as the light blue tracing. The regions containing the SVIL and LYZL1 genes are indicated by green arrows.

