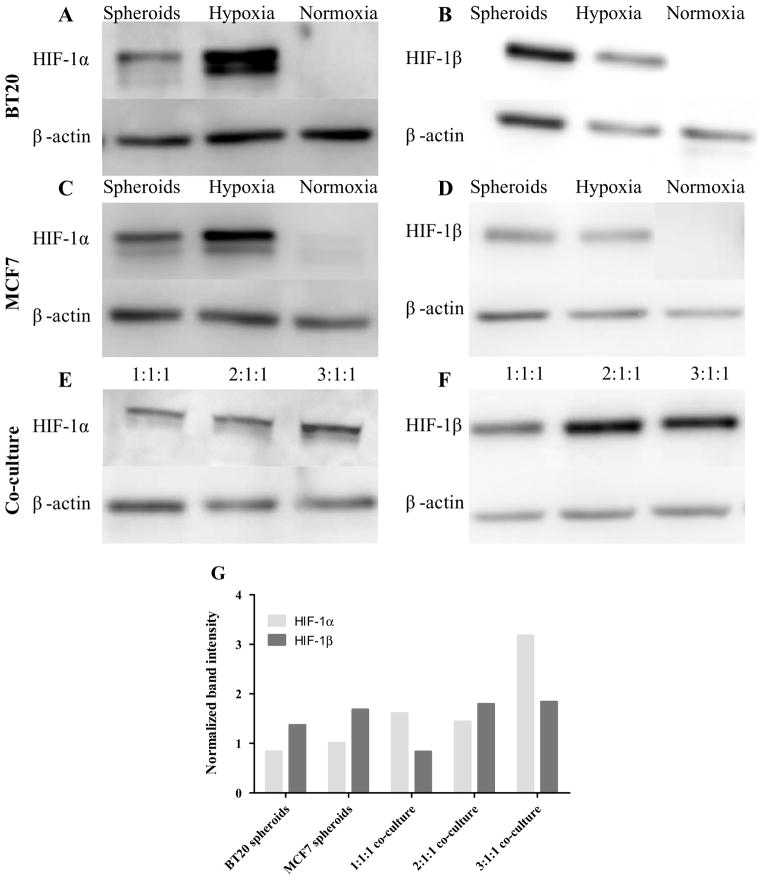
Fig. 10.
Western blot membranes showing the expression of HIF-1α and HIF-1β in spheroid, monolayer (Normoxia) and monolayer cells treated with cobalt chloride (Hypoxia) in BT20 (A and B), MCF7 (C and D) and co-culture spheroids (E and F). The ratio indicated in the figure corresponds to BT20:MCF7:MCF10A cells in co-culture. The band intensity computed using ImageJ indicates that expression of HIF-1α increased in co-culture conditions (G).

