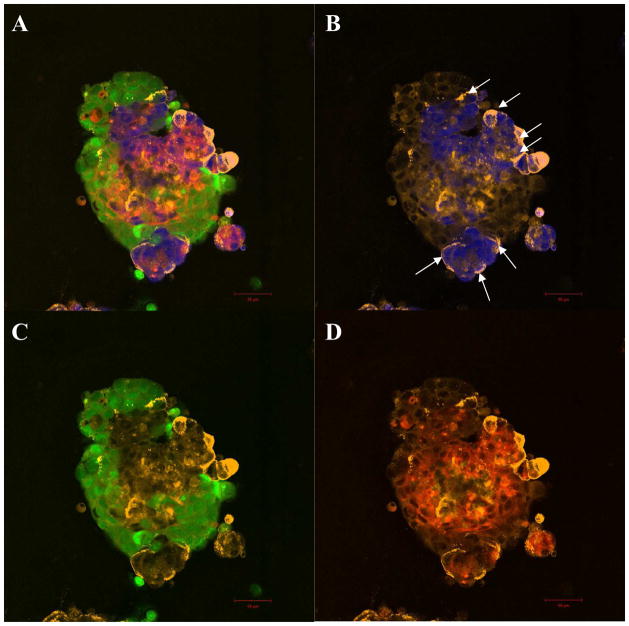
Fig. 6.
Confocal microscopy images of soluble E-selectin (orange) binding to whole co-culture spheroids with BT20 (blue) MCF7 (green) and MCF10A (red) cells on PDMS (A). Superimposed images of soluble E-selectin with individual cell types in co-culture indicate preferential binding of soluble E-selectin to BT20 cells in co-culture (B) when compared to MCF7 (C) or MCF10A cells (D) in co-culture. [Scale bars=50 μm]

