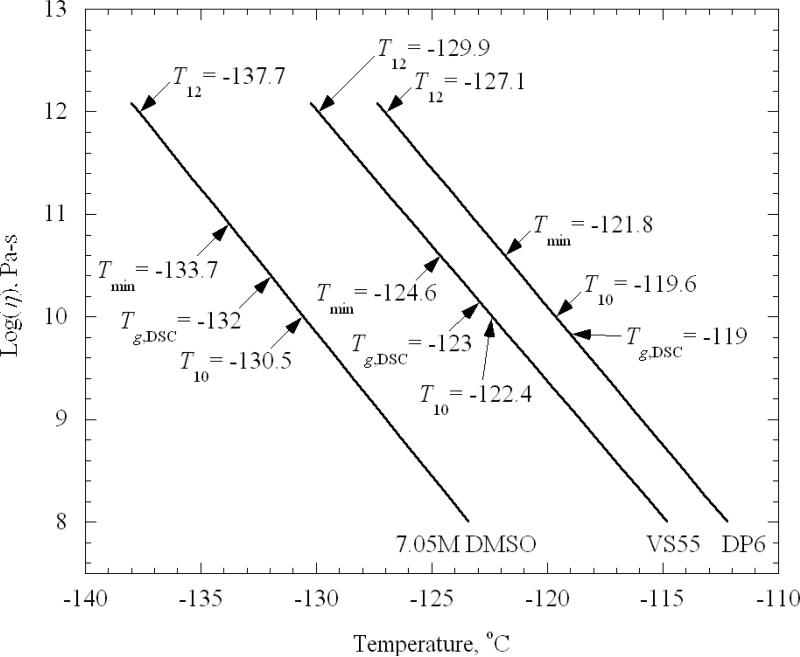
Figure 6.
Best-fit results for viscosity as a function of temperature, where T12 denotes the temperature at which the viscosity extrapolates to a value of 1012 Pa-s, Tmin denotes the lowest temperature at which experimental data were obtained for that CPA, Tg,DSC denotes the glass transition temperature measured by differential scanning calorimetry (corresponding to the peak overshoot during rewarming), and T10 denotes the temperature at which the viscosity reaches a value of 1010 Pa-s.

