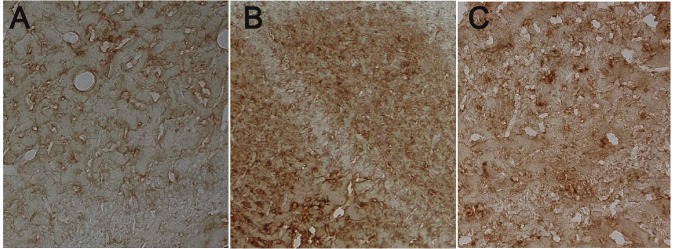
Figure 4.
Apoptotic cells in the brain of different groups. A: Apoptotic neurons in the brain of control group. Positive cells were yellow (DAB, 100×); B: Apoptotic neurons in the affected hemisphere of HIBD group. Positive cells were yellow (DAB, 100×); C: Apoptotic neurons in the affected hemisphere of HBO group. Positive cells were yellow (DAB, 100×).

