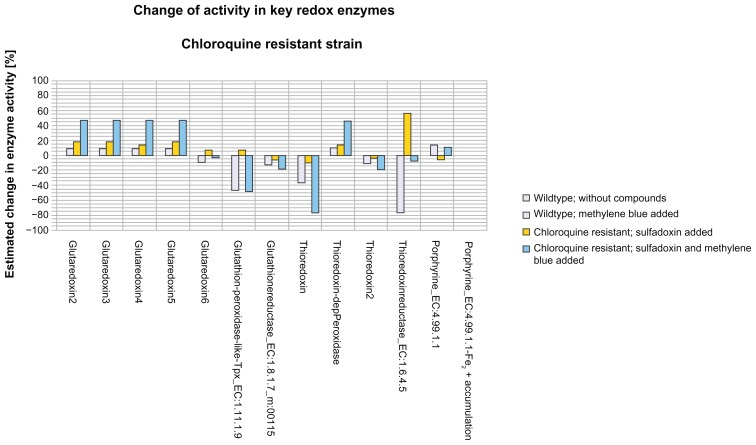
Figure 5.
Changes in key redox enzymes—chloroquine-resistant strain.
Notes: Shown are the effects of sulfadoxine on key redox enzymes in a chloroquine-resistant plasmodium strain (yellow bar). The y-axis denotes estimated changes in enzyme activity in percent, the x-axis compares key redox enzymes. Also shown are the effects of a combination of sulfadoxine and methylene blue (blue bars), as well as the effects of MB on a non-resistant strain (grayish blue bar). As a baseline, the enzyme activities of a non-resistant strain without any added compounds were taken. Standard deviations (see Fig. 4 legend) after calculating the pathway activities were as follows: wild type: 0.53; wild type and added MB: 0.54; sulfadoxine-pyrimethamine and chloroquine added: 0.68; sulfadoxine-pyrimethamine, chloroquine, and MB added: 0.66.

