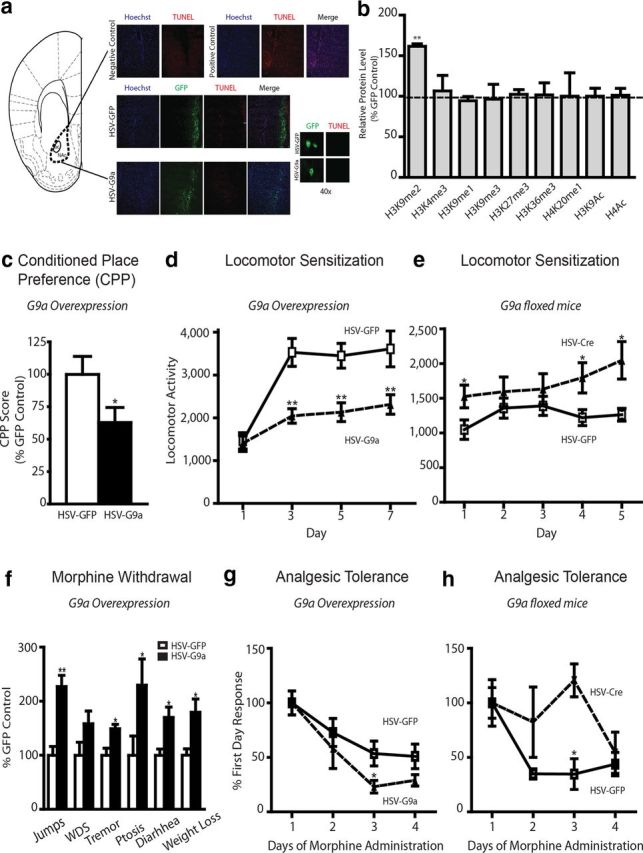
Figure 2.

G9a regulates morphine-induced behaviors. a, TUNEL/immunohistochemical analysis of NAc sections after HSV–GFP or HSV–G9a surgery, along with negative and positive controls. b, Western blot analysis for various chromatin modifications after HSV–G9a infusion into the NAc. c, CPP. Animals were trained to pair morphine or saline with two contextually distinct chambers for 3 d after viral-mediated gene transfer with HSV–G9a or HSV–GFP, and CPP scores were calculated as the difference in time spent between the morphine- and saline-paired chambers. Two-tailed Student's t test, *p < 0.05. d, Locomotor sensitization after G9a overexpression. Animals were habituated in a locomotor chamber after saline injections. Morphine (10 mg/kg, s.c.) was then administered daily, alternating between the locomotor box and their home cage for 7 d. Animals (HSV–GFP, white squares; HSV–G9a, black triangles) were monitored for locomotor activity for 30 min on days 1, 3, 5, and 7. A two-way ANOVA was used, followed by Bonferroni's post hoc analysis. Day: F(3,60) = 13.59, p < 0.001; virus: F(1,60) = 28.98, p < 0.001; day × virus: F(3,60) = 2.893, p < 0.05. **p < 0.01, post hoc test. e, Locomotor sensitization after Cre-mediated G9a knockdown in the NAc of G9afl/fl mice. Mice (HSV–GFP, white squares; HSV–Cre, black triangles) were monitored for locomotor activity for 30 min for 5 consecutive days of morphine treatment (5 mg/kg). Two-way ANOVA; day: F(4,76) = 1.004, NS; virus: F(1,76) = 15.54, p < 0.001; day × virus:F(4,76) = 0.7863, NS. *p < 0.05, post hoc test. f, Physical withdrawal. Mice were injected intraperitoneally with escalating doses of morphine (20, 40, 60, 80, 100, and 100 mg/kg) every 8 h for 2.5 d. Two hours after the last morphine injection, naloxone (1 mg/kg) was administered subcutaneously. Withdrawal behaviors (jumps, wet dog shakes, tremors, ptosis, diarrhea, and weight loss) were then monitored for 30 min. Bonferroni's post hoc test, *p < 0.05, **p < 0.01. g, h, Analgesic tolerance. A hotplate test was used, in which the latency for paw lick was recorded. The antinociceptive response was calculated as a percentage of MPE, where MPE = (test − control latency)/(cutoff − control) × 100, and responses were normalized to the first day. Repeated morphine injections (15 and 20 mg/kg, s.c., for g and h, respectively) were given daily for 4 d, and analgesia was measured 30 min after each drug dose. For g, HSV–GFP, white squares; HSV–G9a, black triangles. A two-way ANOVA followed by Bonferroni's post hoc analysis were performed. day: F(3,57) = 12.32, p < 0.001; virus: F(1,57) = 4.17. p < 0.05 *p < 0.05, post hoc test. For h, HSV–GFP, white squares; HSV–Cre, black triangles. A two-way ANOVA followed by Bonferroni's post hoc analysis were performed. virus: F(1,36) = 7.20, p < 0.05. *p < 0.05, post hoc test.
