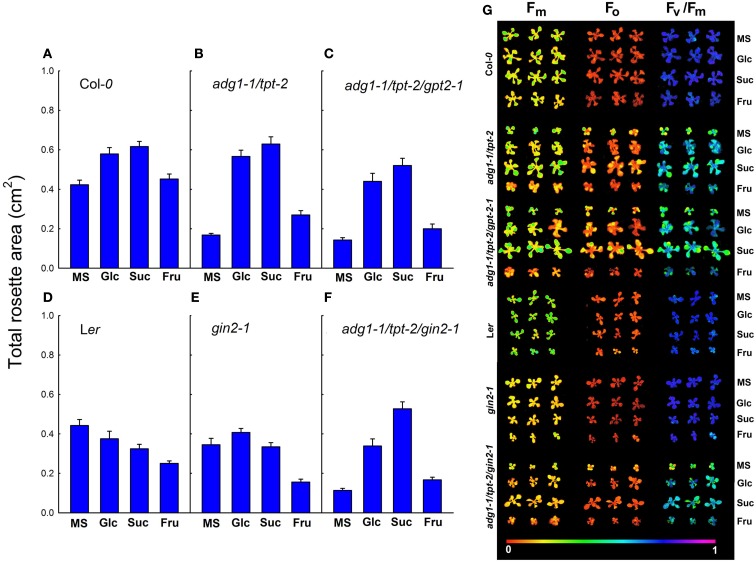
Figure 2.
Impact of sugar feeding on the total rosette area of Col-0 (A), adg1-1/tpt-2 (B), adg1-1/tpt-2/gpt2-1 (C), Ler (D), gin2-1 (E), and the adg1-1/tpt-2/gin2-1 triple mutant (F). The data represent the mean ± SE were eight individual plants per line and treatment. Photosynthetic basic parameters (Fm, Fo, and the Fv/Fm ratio) of all lines comprised in (A–F) were measured with an Imaging-PAM fluorometer and are presented as false color images in response to external sugars (G). The plants were grown for 3 weeks at a light/dark cycle of 16 h/8 h and a PDF of 300 μmol m−2 s−1. The bar in (G) represents the numeric values of the false color images. The determination of the above parameters was conducted after 5 h in the light.

