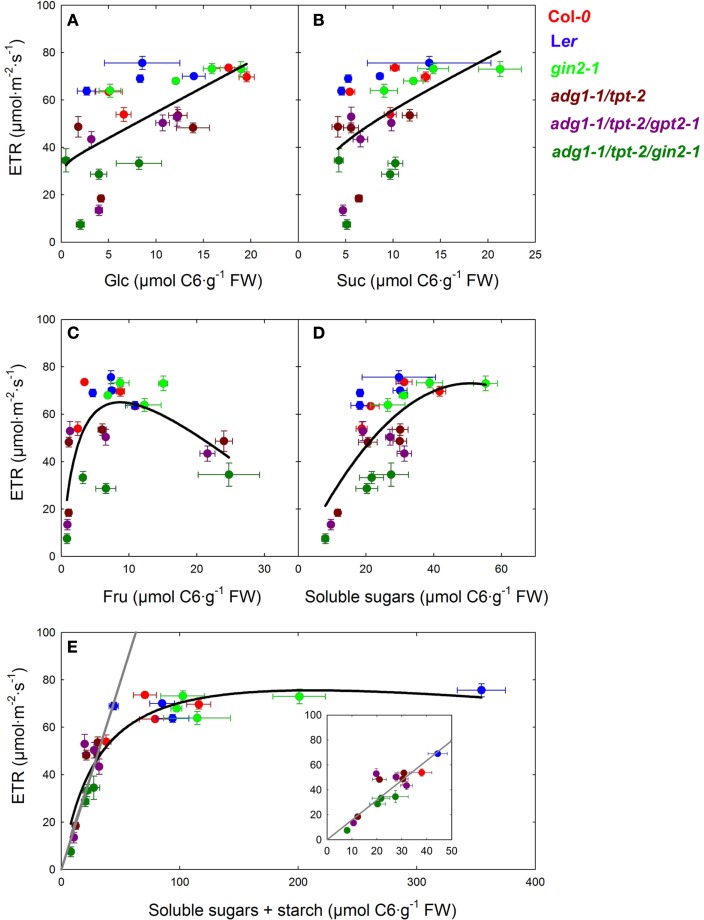
Figure 7.
Plots of photosynthetic ETR, obtained from steady state values in Figure 4, vs. the average content of Glc (A), Suc (B), and Fru (C) as well as the sum of contents of soluble sugars (D), and total carbohydrates, including starch (E). The black lines represent curve fits of the data points to single rectangular three parameter hyperbolas (f = a·x/[b + x] + c·x), whereas the gray lines derive from a linear regression analysis of all data points at total carbohydrate contents below 50 μmol C6·g−1 FW [see inset in (E)]. For the linear regression analysis a correlation coefficient of R = 0.874 was obtained. The individual plant lines are represented by different colors and are defined as Col-0 (red), Ler (blue), gin2-1 (light green), adg1-1/tpt-2 (dark red), adg1-1/tpt-2/gpt2-1 (dark purple), and adg1-1/tpt-2/gin2-1 (dark green).

