
Figure 4.
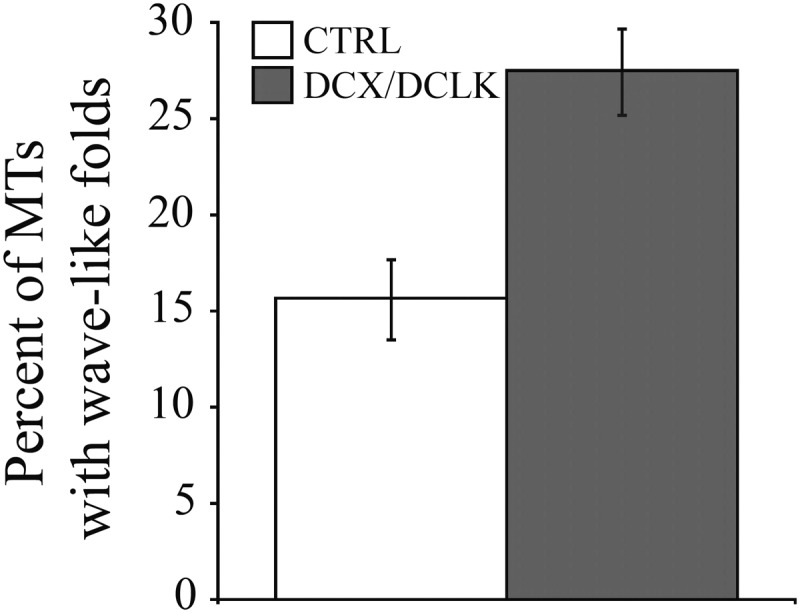
Quantitative analyses showing the effect of DCX–DCLK depletion on the contour of growth cone microtubules. The graph shows the percentage of microtubules with wave-like folds in growth cones of control neurons and neurons depleted of DCX+DCLK. Knockdown of both DCX and DCLK significantly increased the frequency of microtubules with wave-like folds [P < 0.0001, χ2-test, comparing control neurons (90 growth cones) with depleted neurons (92 growth cones)].