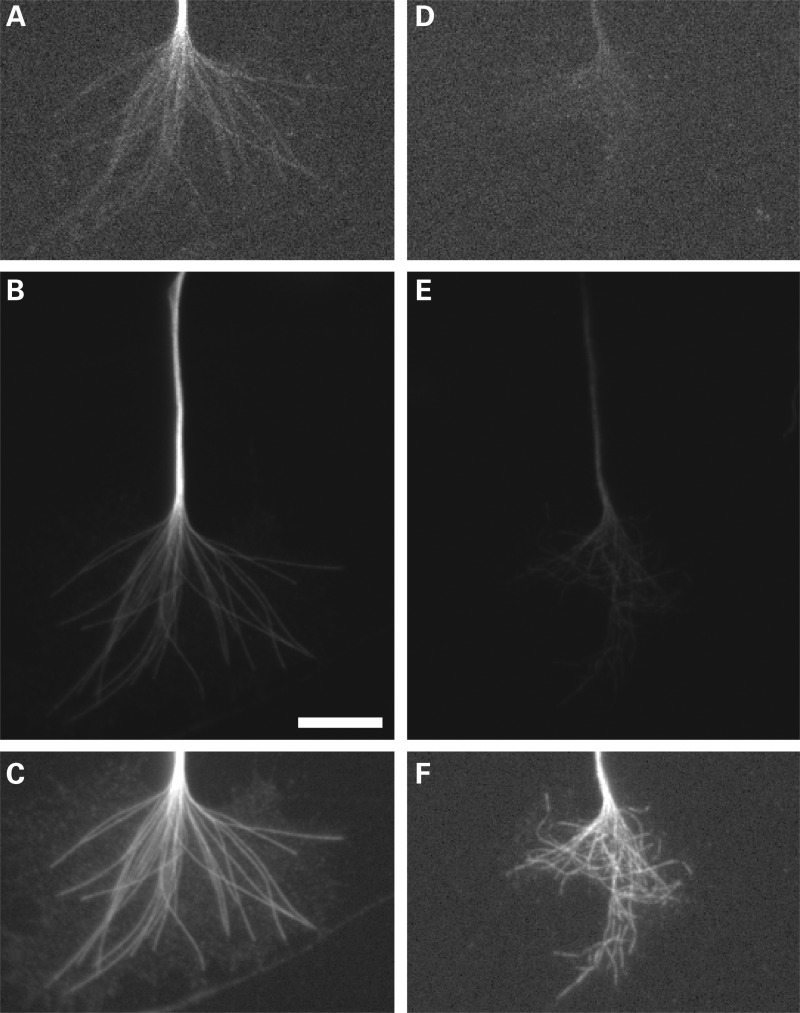
Figure 7.
DCX overexpression straightens growth cone microtubules. Left and right panels are images of two representative control growth cones from a culture of transfected neurons, one that highly expressed EGFP-DCX (A–C), and one that minimally expressed this construct (D–F). (A and D) Staining for EGFP to demonstrate the relative level of expression. (B and E) Staining for DCX in which the exposure times and enhancing are identical. Visual inspection provides an indication of the relative abundance of DCX in the two neurons, and it is clear that the abundance of DCX is several-fold greater in the neuron expressing exogenous DCX (B) compared with the cell that is not expressing ectopic DCX (E). Quantitative analyses indicate that on average, neurons expressing the human DCX contained ∼6-fold more DCX in the growth cone than neurons that did not express the human DCX. (C and F) The same growth cones depicted in (B) and (E), but each enhanced differently to optimize visualization of growth cone microtubules staining for DCX; microtubules are strikingly straighter in the neuron overexpressing DCX. Scale bar = 6 μm.

