
Figure 3. Gene expression of LSB3i nociceptors.
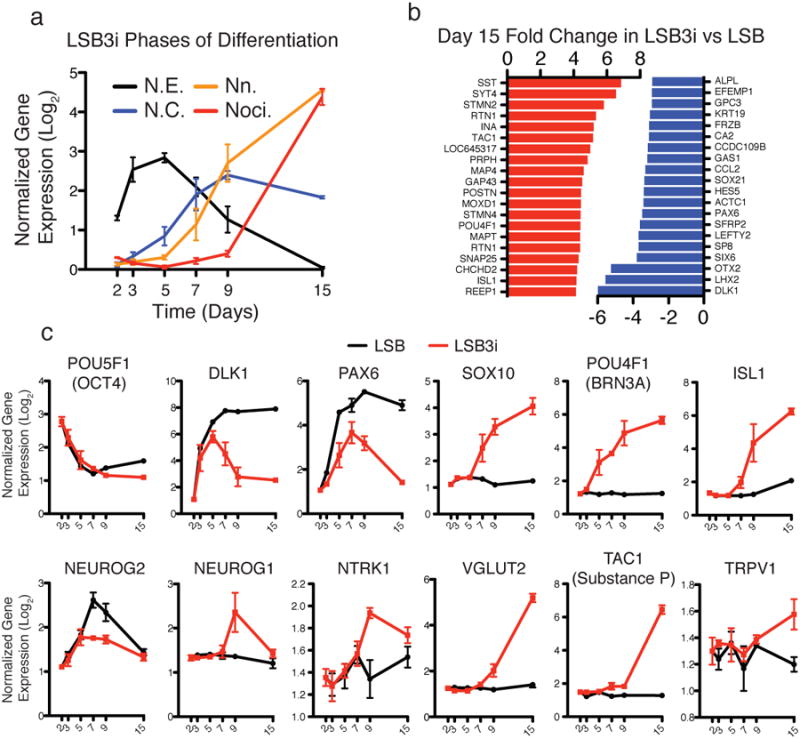
Gene expression analysis was performed on days 2, 3, 5, 7, 9, and 15 for both LSB and LSB3i treated cells. (a) Distinct phases of differentiation are observed when examining markers for neuroectoderm, neural crest, neurons, and nociceptors (N.E., N.C., Nn., and Noci.). (b) Top twenty significant up- (red) and downregulated (blue) genes by fold change at day 15 for LSB3i compared to LSB. (c) Expression of OCT4, DLK1, PAX6, SOX10, POU4F1 (BRN3A), ISL1, NEUROG2, NEUROG1, NTRK1, VGLUT2, TAC1, and TRPV1 are consistent with emergence of a nociceptor.