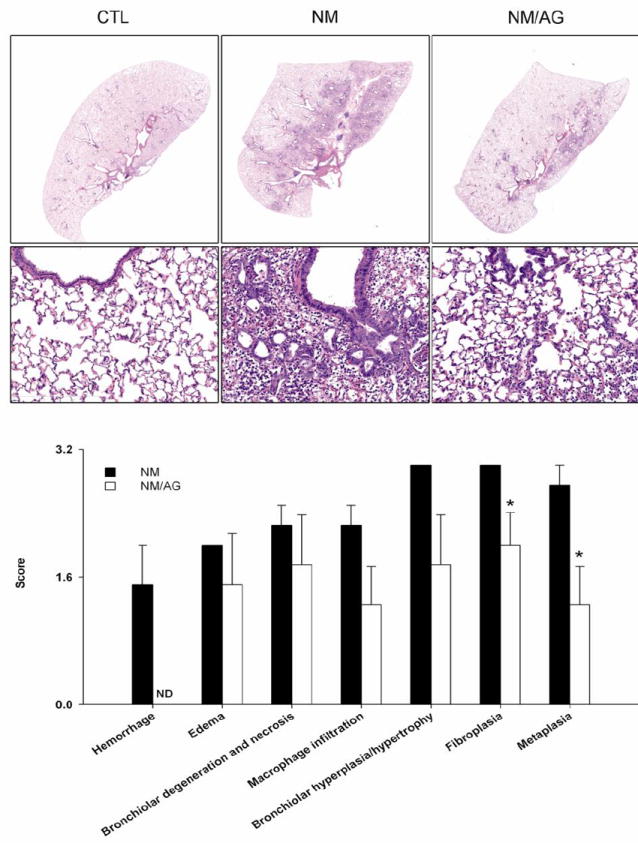
Figure 4. Effects of AG on NM-induced structural alternations in the lung.

Upper and middle panels. Lung sections, prepared 3 d after treatment of rats with PBS control (CTL), NM, or NM + AG (NM/AG), were stained with H & E. Images were acquired using a NanoZoomer 2.0-RS scanner. Original magnification, 0.65x (top panel); 20x (middle panel). Lower panel. Lung sections were scored for histopathologic changes. PBS control (CTL) = zero for all parameters assessed. Each bar is the mean ± SE (n = 4 rats/treatment group). *Significantly (p ≤ 0.05) different from NM; ND, not detectable.
