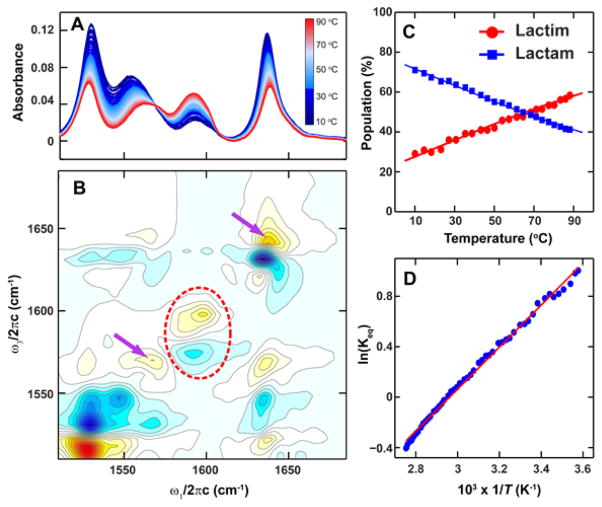
Figure 4.
Temperature dependence of 6-chloro-2-pyridone. (A) FTIR from 10oC (blue) to 90° C (red). (B) The second component spectrum calculated from the SVD analysis of the temperature dependent 2D IR spectra. (C) Populations of the lactim (2a, red circle) and lac-tam (2b, blue square) tautomers determined from the temperature-dependent FTIR. The solid lines are fits to Equation S3. (D) Arrhenius plot.

