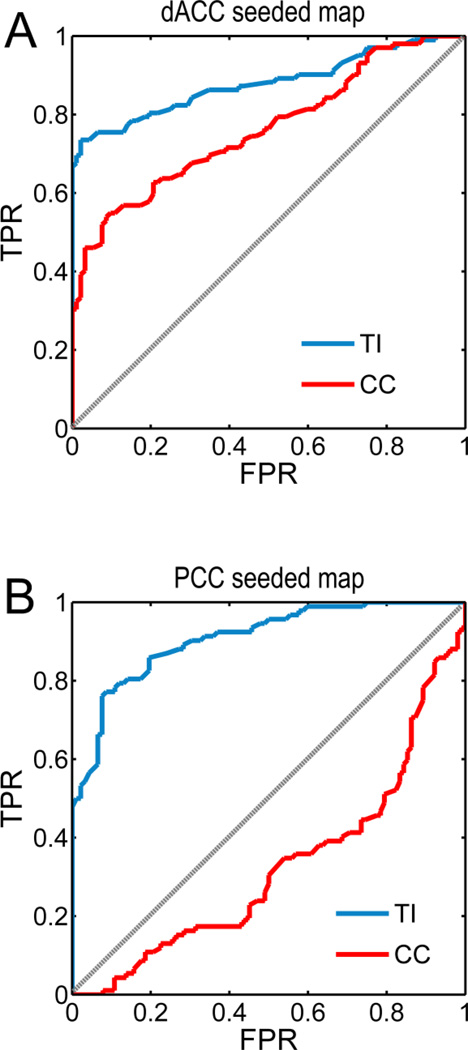
Figure 6.
ROC analysis of statistical sensitivity. A: True positive rate (TPR) versus false positive rate (FPR) as function of discrimination threshold when deciding whether a predefined voxel belonged to TCN in the dACC-seeded resting-state maps. Task-activated voxels in rAI and rFEF were defined as the true and false populations respectively. B: TPR versus FPR when deciding whether a predefined voxel belonged to DAN in the rIPS-seeded resting-state maps. Task-activated voxels in rFEF and rAI were defined as the true and false populations respectively. In both cases TI achieved superior statistical sensitivity over CC.

