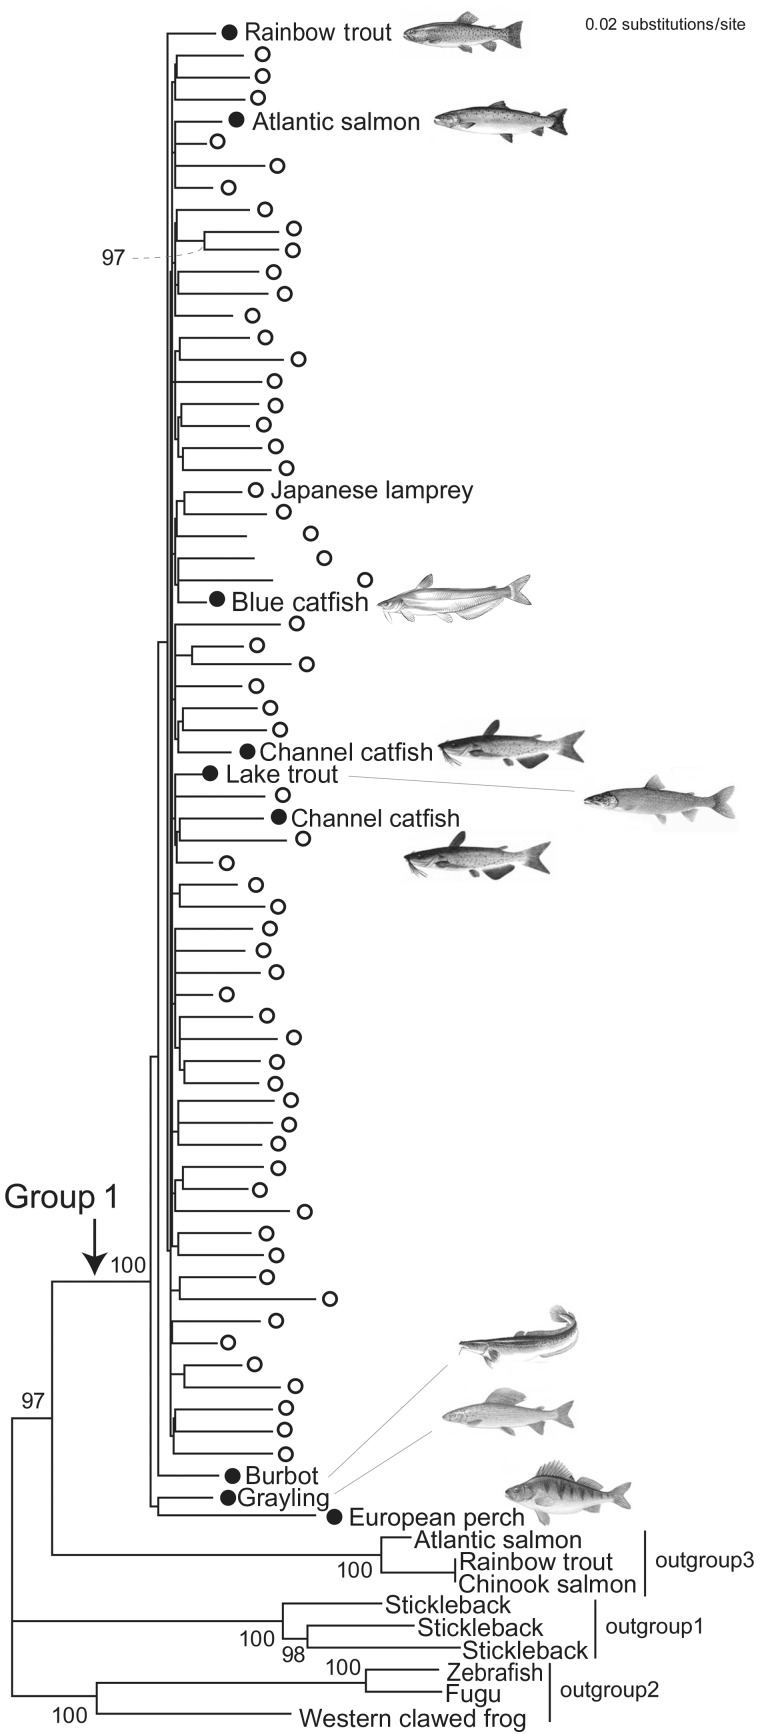
Fig. 2.—
Molecular phylogenetic tree of Group 1 Tc1 sequences. This tree was inferred with the maximum-likelihood method based on 78 nucleotide sequences (1,020 sites). Highly similar sequences within species were excluded except for one (see Materials and Methods). White open circles indicate lamprey sequences, of which a sequence of the Japanese lamprey is particularly indicated. Filled circles indicate teleost sequences. Only bootstrap values greater than 80 are shown. Bootstrap values for remaining nodes are all below 67 (particularly, those within Group 1 are mostly less than 30). See supplementary table S1, Supplementary Material online, for details of outgroups 1–3.

