
Fig. 4.—
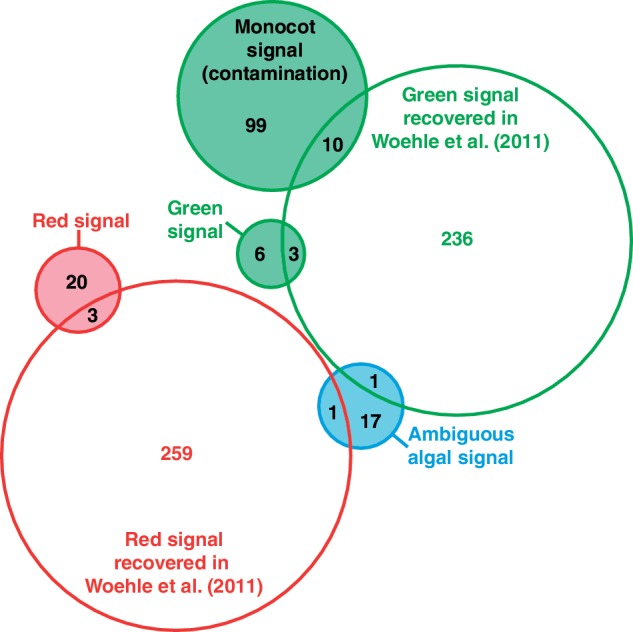
Venn diagram showing the number of overlapping genes between this study and Woehle et al. (2011). The filled circles correspond to the genes recovered in this study.
Official websites use .gov
A
.gov website belongs to an official
government organization in the United States.
Secure .gov websites use HTTPS
A lock (
) or https:// means you've safely
connected to the .gov website. Share sensitive
information only on official, secure websites.
Venn diagram showing the number of overlapping genes between this study and Woehle et al. (2011). The filled circles correspond to the genes recovered in this study.