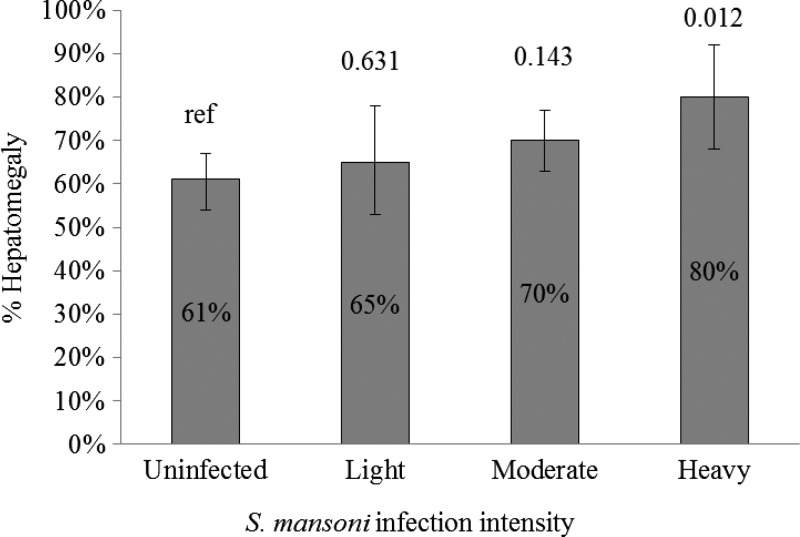
Figure 4.
Proportion of children with hepatomegaly by intensity of Schistosoma mansoni infection. Gray bars represent the percent of children with hepatomegaly stratified by infection intensity. Whiskers above the bars represent 95% confidence intervals around the percent with hepatomegaly. Numbers above the whiskers represent P values comparing the stratum value to the uninfected population.

