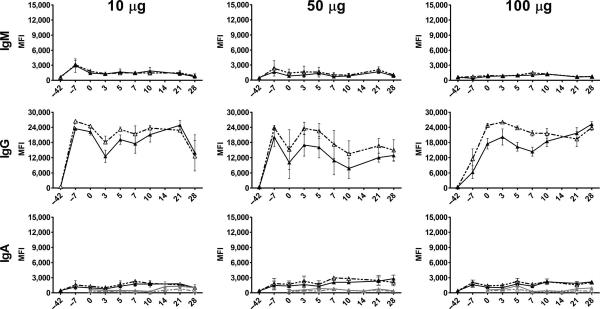
Fig. 4.
NiV- and HeV-specific Ig in vaccinated subjects. Serum and nasal swabs were collected from vaccinated subjects, and IgG, IgA, and IgM responses were evaluated using sGHeV and sGNiV multiplexed microsphere assays. Sera or swabs from subjects in the same vaccine dose group (n = 3) were assayed individually, and the mean of microsphere MFIs was calculated, which is shown on the y axis. Error bars represent the SEM. Serum sG-specific IgM, IgG, and IgA are shown in black (sGHeV and sGNiV), and mucosal sG-specific IgA is shown in gray (sGHeV and sGNiV).

