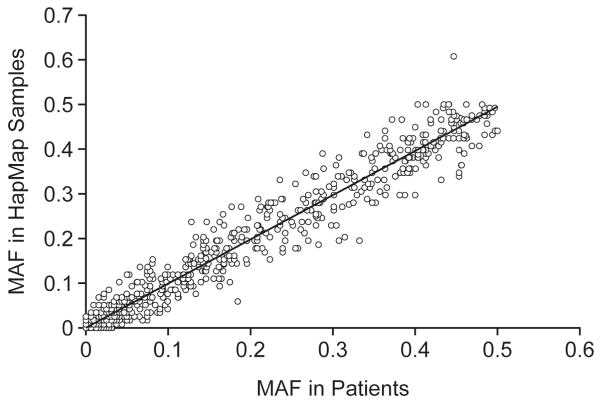
Figure 2. Concordance of DMET MAF with HapMap CEU MAF.
The minor allele frequency (MAF) of all SNPs that passed quality control was determined in patients of European ancestry (x-axis) and compared to the corresponding frequency in HapMap CEU samples (y-axis). Linear regression between the DMET and HapMap allele frequencies suggest that the values between the populations are highly correlated (R2 = 0.9711).

