Fig. 9.
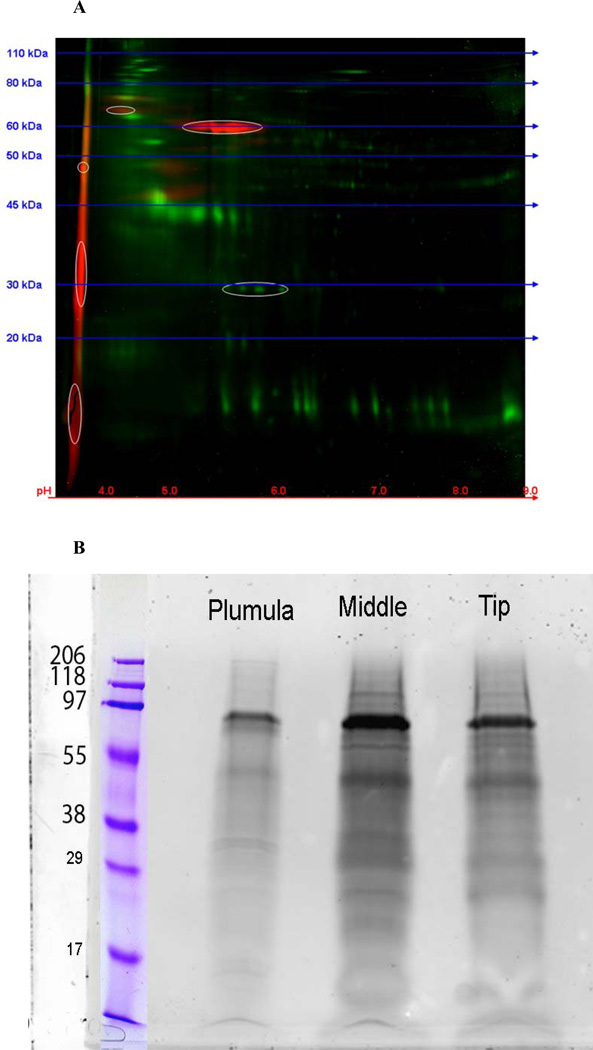
Gel electrophoresis of the total HCL extract of Gdn.HCl washed L. v. teeth The red stains are for bound phosphates, green for other proteins. A. A 2-D gel of the HCl extract of the total mineralized portion of an urchin tooth. Red- phospho-stain, Greentotal protein. The phosphoproteins are mainly very acidic, with pI <4.0. Development of the 2-D gel was stopped before the most acidic components could run off the left edge of the gel. B. Standard 1-D SDS-gels. The urchin tooth was cut into sections comprising the plumula, the highly mineralized midsection, and the incisal tip and the HCl extracts were prepared separately. After routine SDS-gel electrophoresis, they were stained with a phospho-specific dye. Protein loading was equivalent in the Plumula, Middle and Tip labeled lanes. These data show the non-uniform distribution of mineral-related phosphoprotein components in the different parts of the tooth. The molecular size markers were different in A and B and serve only as guides to the relative values.

