Figure 3.
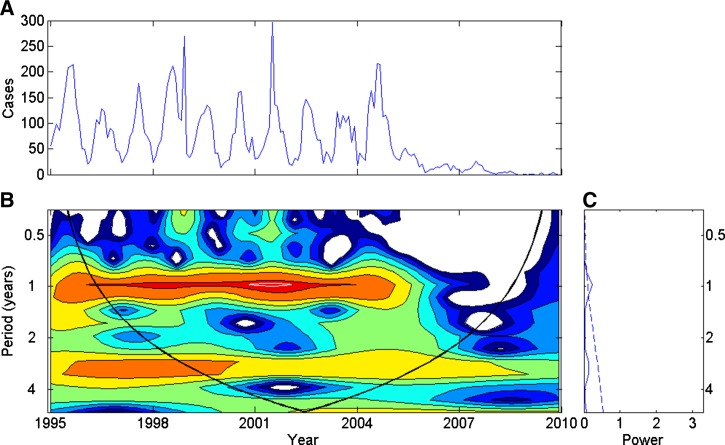
Wavelet time series analysis for the monthly Plasmodium falciparum malaria cases time series, Hainan, China, 1995–2008. A, Time series. B, Local wavelet power spectrum (LWPS). Blue to red color-coding indicates increasing power. The white line in LWPS corresponds to the 5% significance level. The area encompassed by the white line indicates that the annual peak was pronounced during 2001–2003. A relatively strong, but not significant, periodicity was detected in the area with red or orange color, but which was not encompassed by the white line; note the annual peak before 2005 and the three-year periodicity during 1998–2006. The trend of periodicity could be analyzed according to the color of the LWPS, but it was determined to not reach statistical significance. The superimposed parabola indicates the cone of influence, measuring the extent of edge effects. C, Global wavelet spectrum, which is analogous to the traditional Fourier spectrum. The peaks of power around one year and three years can be observed.

