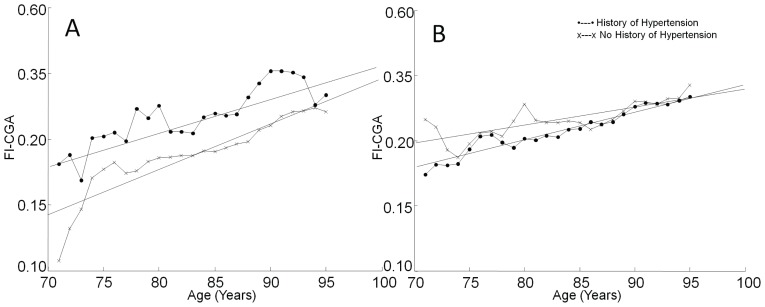
FIGURE 3.
Relationship between frailty and age. A frailty index based on comprehensive geriatric assessment (FI-CGA) was calculated for each group and plotted as a function of age. (A) Relation between age and FI-CGA in nonmedicated individuals. The slope of the best-fit line for mean change was 0.035 in those with no history of hypertension and 0.026 in those with a history of hypertension. (B) The relationship between age and FI-CGA in individuals on antihypertensive medication. The slopes of the best-fit lines declined in both groups on treatment (0.022 in those with a history of hypertension and 0.014 in those with no history of hypertension).

