
Fig. 4.
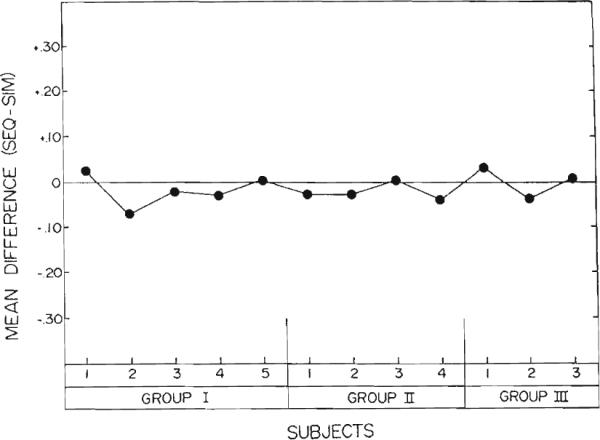
Data from Expt II. For each subject, the graph depicts the probability of correct consonant judgment during the sequential condition minus the probability of correct consonant judgment during the simultaneous condition. Points above the solid line represent a possible attentional effect.