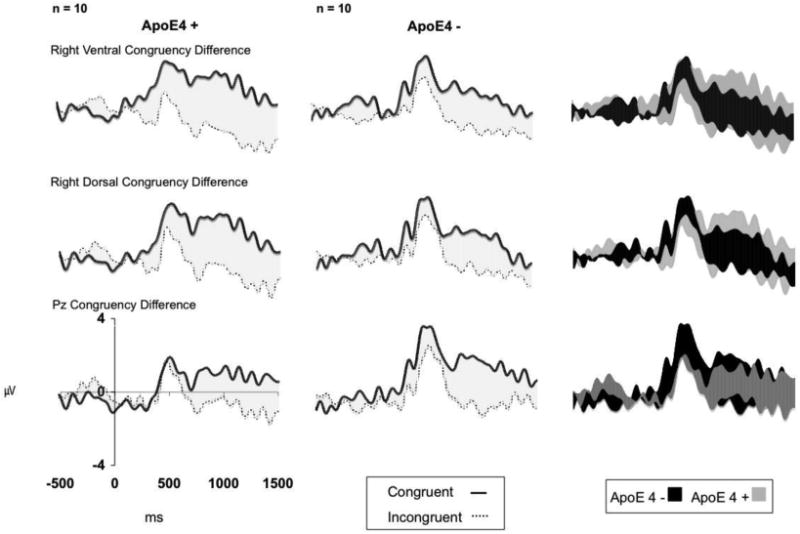
Figure 2.

Grand average ERP congruency differences recorded from the Pz site, (Lower), right dorsal regions (Middle), and the right ventral regions (Upper), displayed by ApoE ε4 status. The shading illustrates differences in response between congruent and incongruent stimuli. Solid lines represent congruent ERPs while incongruent ERPs are represented by dotted lines.
