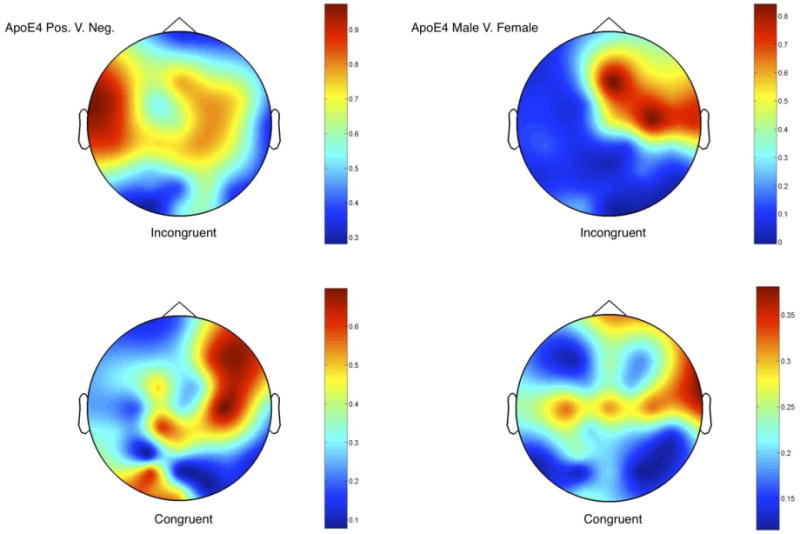
Figure 4.

The Intra Class Correlations comparing waveshape and amplitude similarities for averaged congruent (left) and incongruent (right) ERPs (600-1300ms) between ApoE ε4 positive and negative carriers (top) and positive male and female carriers are displayed topographically. Scales show the correlations and are relative for each comparison. Lowest correlations are in blue while highest correlations are in red.
