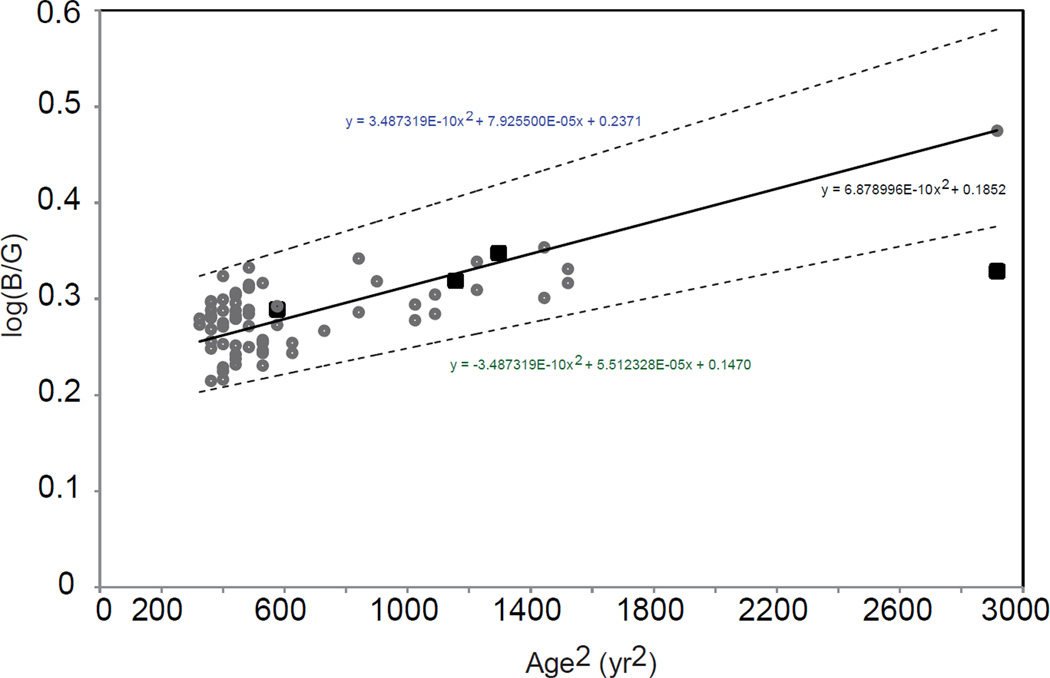
Figure 4.
Moreland match midpoints (log B/G) plotted as a function of age squared (years2) for 64 normal trichromats (filled circles) and four with the T190I mutation (filled squares). The solid line is the Kraats & van Norren age function (van de Kraats & van Norren, 2007) calculated to fit the normal data and the dashed lines are 95% confidence limits (1.96 × SD). The confidence limits may be too narrow for the older age groups as they are based on subjects aged 18–38 yrs.

