
Fig. 1.
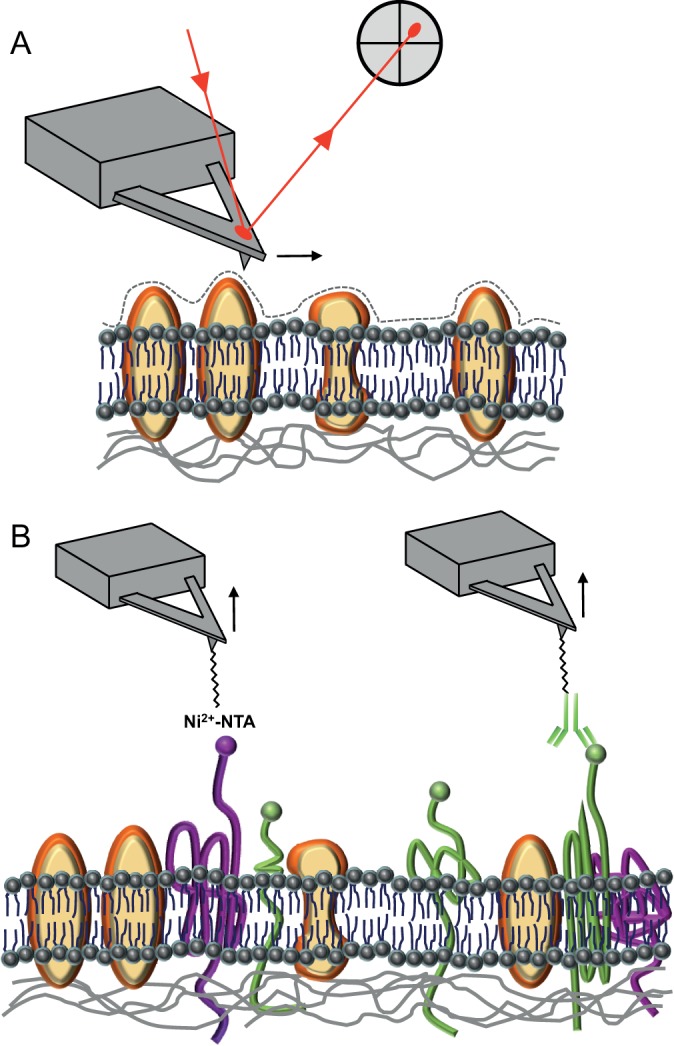
Atomic force microscopy. (A) In the imaging mode, a very sharp tip follows the contours of the cell surface with nanometer resolution. The lipid bilayer of the plasma membrane is shown, with inserted proteins as yellow objects. (B) In SMFS, the small interaction force between the AFM tip and cell surface molecules is measured, while the distance between the tip and cell is altered. The two examples show a tip labeled with a chemical group (Ni2+-NTA, left) or a ligand (e.g. an antibody, right) to detect, determine the location of and manipulate individual cell surface proteins, such as mechanosensors (shown in magenta and green, respectively).