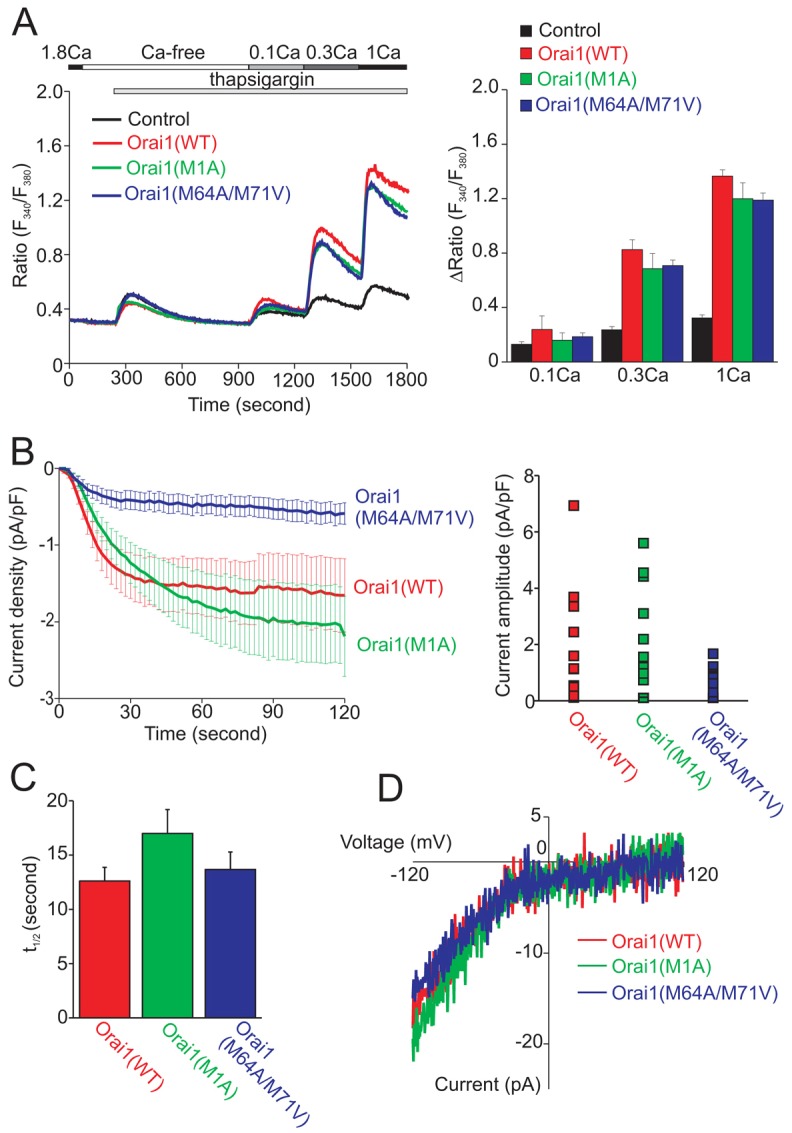
Fig. 4.

Long and short forms of Orai support SOCE and Icrac similarly. (A) Thapsigargin-induced Ca2+ responses in HEK293 cells co-expressing WT, M1A mutant or M64A/M71V mutant of Orai1 with EYFP-STIM1. Cells denoted control expressed EYFP-STIM1 alone. The left panel shows the time course of intracellular Ca2+ mobilization. The timing of extracellular solution exchange and addition of thapsigargin are indicated by horizontal bars above the traces. The right panel depicts the peak values (means ± s.e.m., n = 3) of Ca2+ responses after step-wise restoration of extracellular Ca2+. (B) Icrac recording from HEK293 cells co-expressing WT, M1A mutant or M64A/M71V mutant of Orai1 with EYFP-STIM1. The left panel demonstrates the time course of Icrac development after the establishment of the whole-cell configuration. The right panel shows the distribution of current amplitudes at the time point of 120 seconds for each cell. (C) Average half-times for development of Icrac. Data are means ± s.e.m. (n = 15 for WT, 13 for M1A mutant and 13 for M64A/M71V double mutant). (D) Representative I–V relationship from three cells, one from each condition that has a similar current amplitude.
