
Fig. 2.
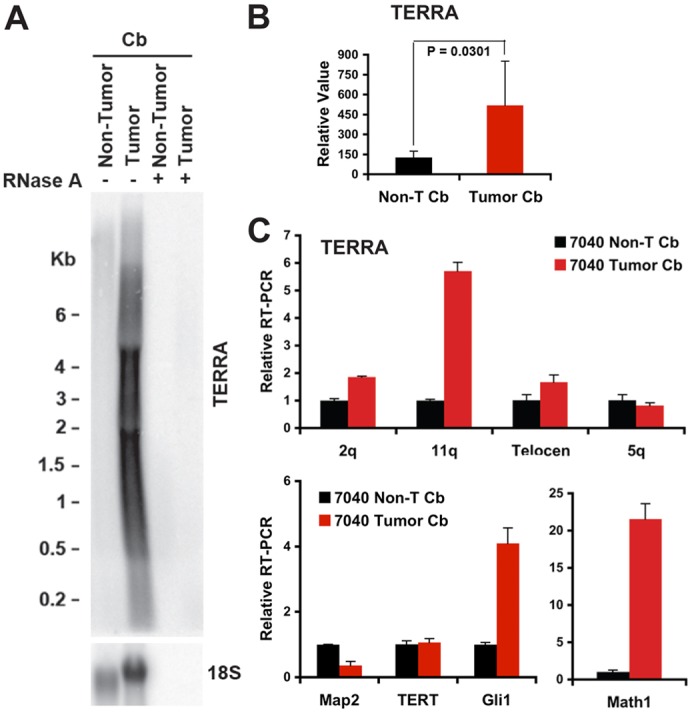
TERRA is highly expressed in mouse primary medulloblastoma. (A) Total RNA from dissected mouse medulloblastoma tumor and non-tumor tissue (no. 7040) were assayed by northern blot and the blot was first probed with 32P-labeled (TAACCC)4 for TERRA RNA expression. 18S RNA expression is shown as a quantification control. Numbers on the left show the position of RNA markers (in kb). (B) Quantification of TERRA levels from at least three independent northern blot analyses using RNA isolated from matched non-tumor and tumor cerebella in different mice, one of which is shown in A. Bar graph represents TERRA signal intensity relative to 18S signal, and relative intensity for non-tumor cerebella was set at 100. The P-value was calculated using a two-tailed Student's t-test. (C) Top panel: quantitative RT-PCR analysis of TERRA using primers specific for subtelomeres of chromosome 2q, 11q, 5q and telocentric chromosomes (Telocen). Lower panel: expression of Map2, Tert, Gli1 and Math1 in non-tumor and tumor cerebellum (no. 7040) to validate the accuracy of dissection. ΔΔCT method relative to non-T cerebellum and Gapdh were used to calculate relative RT-PCR between non-tumor and tumor cerebellum. Bar graph represents the average value from at least three independent PCR reactions (means ± s.d.).