
Fig. 2.
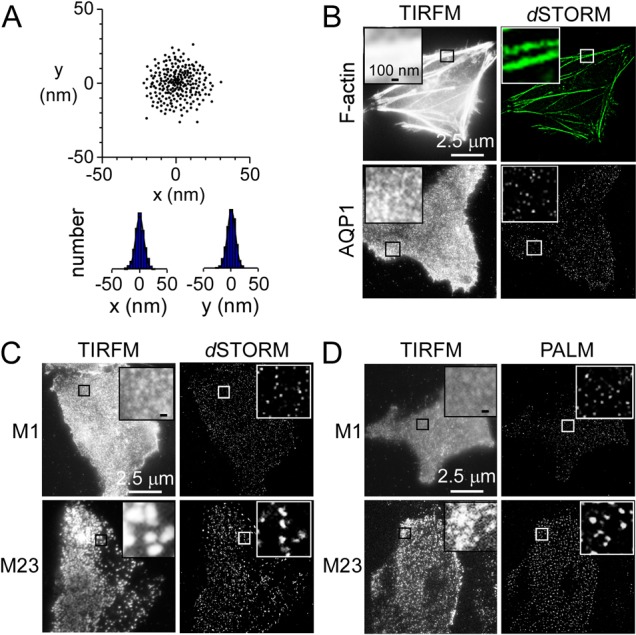
PALM and dSTORM of cells expressing M1- and M23-AQP4. (A) The localization precision of a single fluorophore was determined by localization of immobilized single AQP1–PAmCherry tetramers. Centers-of-mass and deduced spatial histograms with Gaussian fits are shown. (B) Immunofluorescence (TIRFM) and dSTORM of F-actin (top) and AQP1 (bottom) in HeLa cells. Insets show magnified views of boxed regions. (C,D) Immunofluorescence (TIRFM) of M1- and M23-AQP4 in U87MG cells and corresponding dSTORM (C) and PALM (D) reconstructions.