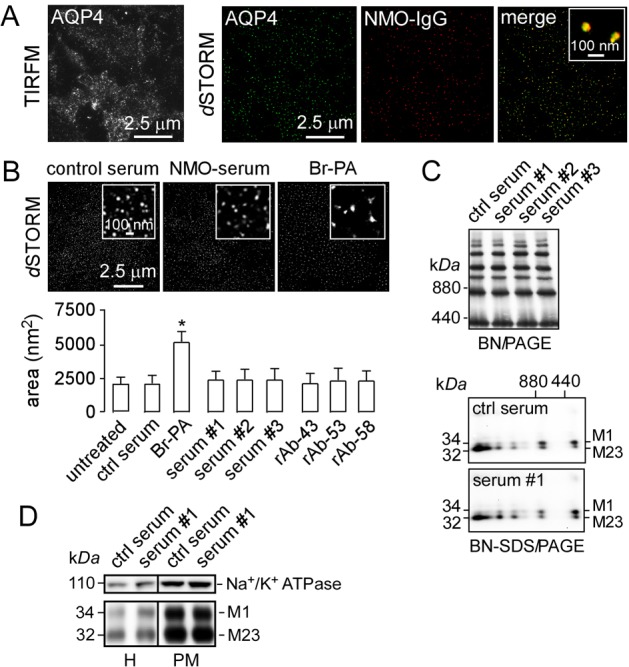
Fig. 5.

OAP imaging in astrocytes. (A) Primary, well-differentiated cultures of mouse astrocytes were fixed and stained with NMO-IgG (red) and C-terminus anti-AQP4 antibody (green) and imaged using TIRFM and two-color dSTORM. (B) dSTORM of astrocytes exposed to control or NMO serum, or treated with 2-bromopalmitate. Average OAP areas summarized at the bottom (mean ± s.e.m., n = 6, P<0.05). (C) BN-PAGE (top) and two-dimensional BN-SDS-PAGE (bottom) of whole-astrocyte homogenates after incubation with control or NMO sera as in B. (D) SDS-PAGE of astrocyte homogenate (H) and plasma membrane fraction (PM) after incubation with control or NMO serum, probed with antibodies against Na+/K+ ATPase (top) and AQP4 (bottom).
