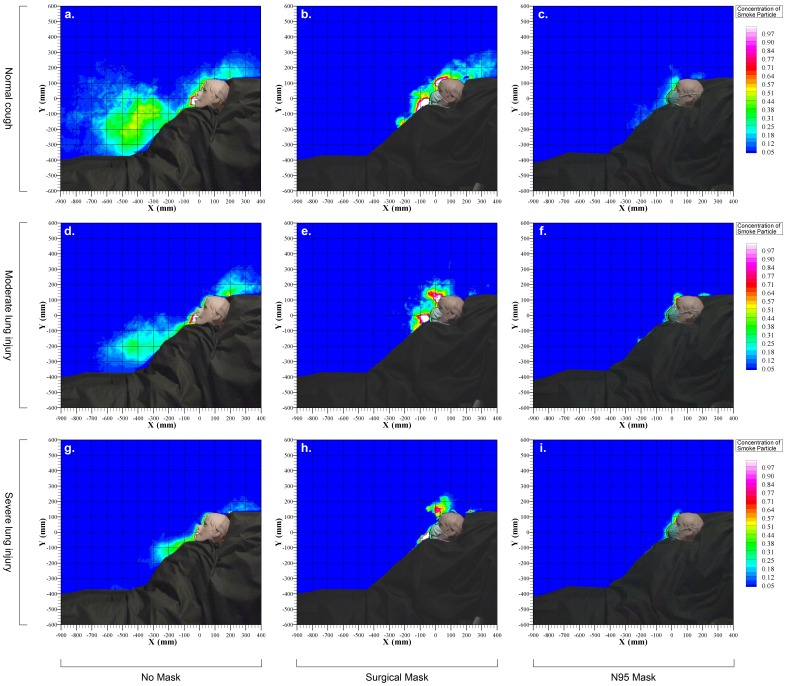
Figure 3. Exhaled air dispersion distances along the median sagittal plane during coughing with and without wearing a surgical or N95 mask.
Normalized concentration in the plume was estimated from the light scattered by smoke particles by computer analysis. The white color code and the red color code represented regions consisting of 100% and 70% respectively of exhaled air whereas the background of the isolation room (deep blue code) was essentially free of exhaled air.

