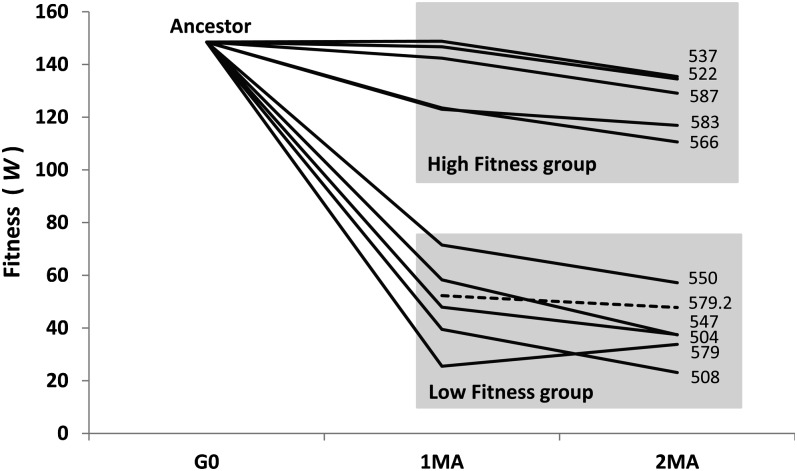
Figure 2 .
Evolutionary trajectories of absolute fitness (W) over 400 generations of MA. Values of absolute fitness are those reported in Table 1. Time points are 0 (G0), 250 generations (1MA), and 400 generations (2MA) of MA. The dashed line depicts the re-assay of Line 579 (see Materials and Methods for details).

