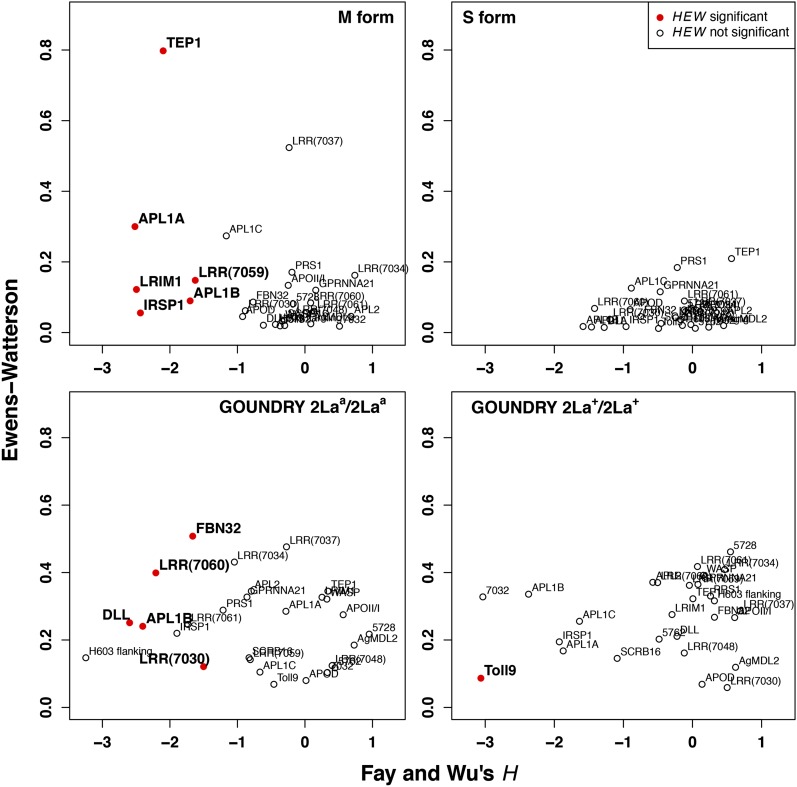
Figure 3 .
The distribution of Fay and Wu’s H and the Ewens-Watterson statistic for all loci in A. gambiae populations. Normalized Fay and Wu’s H and Ewens-Watterson statistics were calculated on synonymous variation at each gene and evaluated by the use of coalescent simulations (see Materials and Methods). Red dots indicate that the HEW statistic is significant at a 5% threshold level after correcting for multiple tests. Each panel presents the results for a different group and the gene names are presented next to the corresponding data point.

