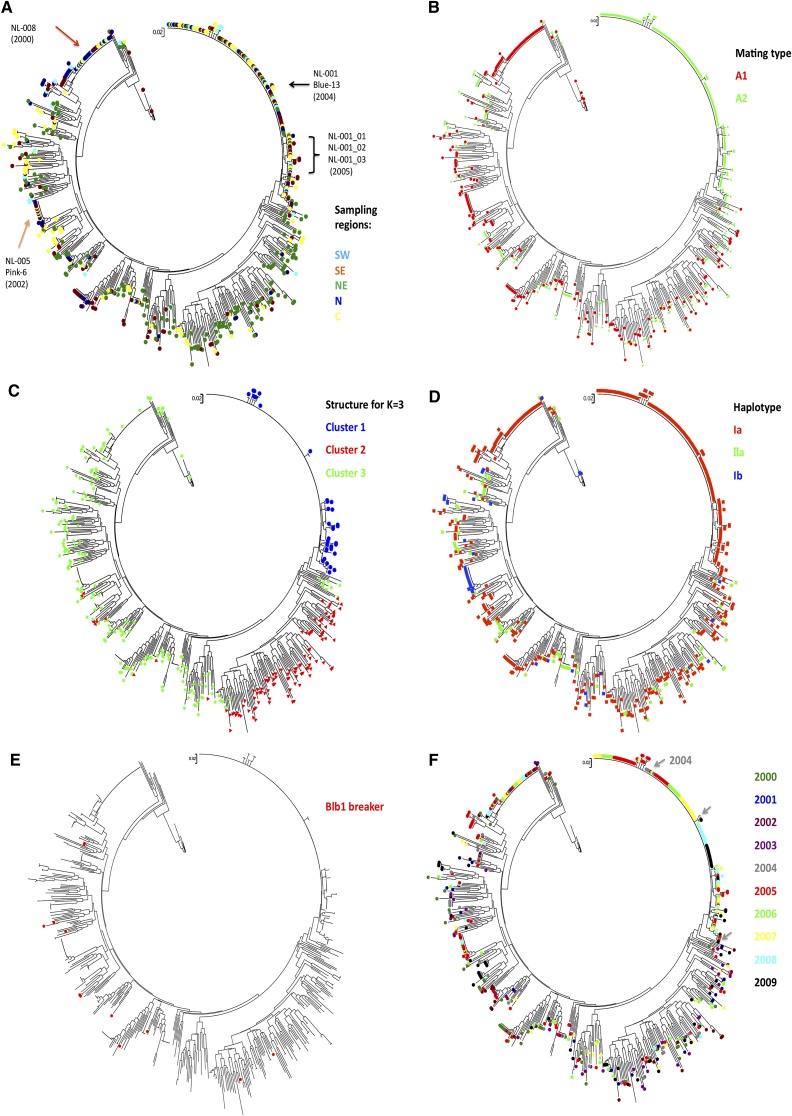
Figure 4 .
Dendrogram of Dutch P. infestans isolates over 10 years using NJ among 12 SSRs. The tree contains 668 isolates and 8 reference isolates (see Materials and Methods). The sampling isolates were marked with colors indicating different characters. (A) Five different sampling regions. (B) Mating types. Green indicates the A2 mating type, and red indicates the rest of the isolates identified with the A1 mating. (C) Result of STRUCTURE analysis. For K = 3, three clusters were clearly identified in this figure, and the isolates within three clusters are aligned on the dendrogram. (D) Three haplotypes identified in the Dutch P. infestans population. (E) Isolates that lack Avrblb1/ipiO class I on the dendrogram. (F) Sampling years of isolates on the dendrogram.

