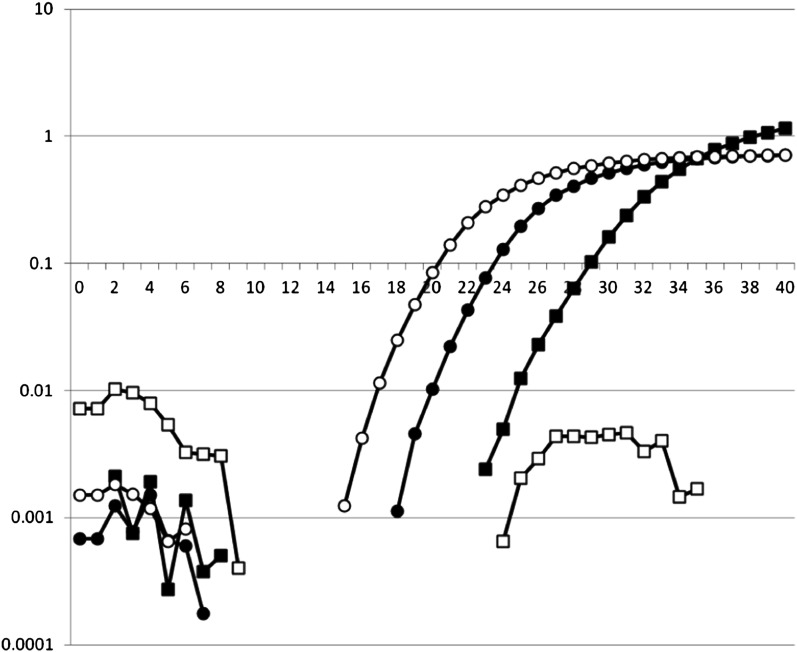
Figure 6 .
The TaqMan screening for Avrblb1/ipiO class I. The number of amplification cycles is shown on the X-axis, and the intensity of detected signal is shown on the Y axis. Open symbols are for the virulent isolate Pic99183, and filled symbols are for avirulent isolate Pic99177. The squares are for Avrblb1/ipiO class I, and the circles are for the ITS PCR control. Isolates that show significant increase in the ITS signal but no increase of the Avrblb1/ipiO class I signal are virulent.

