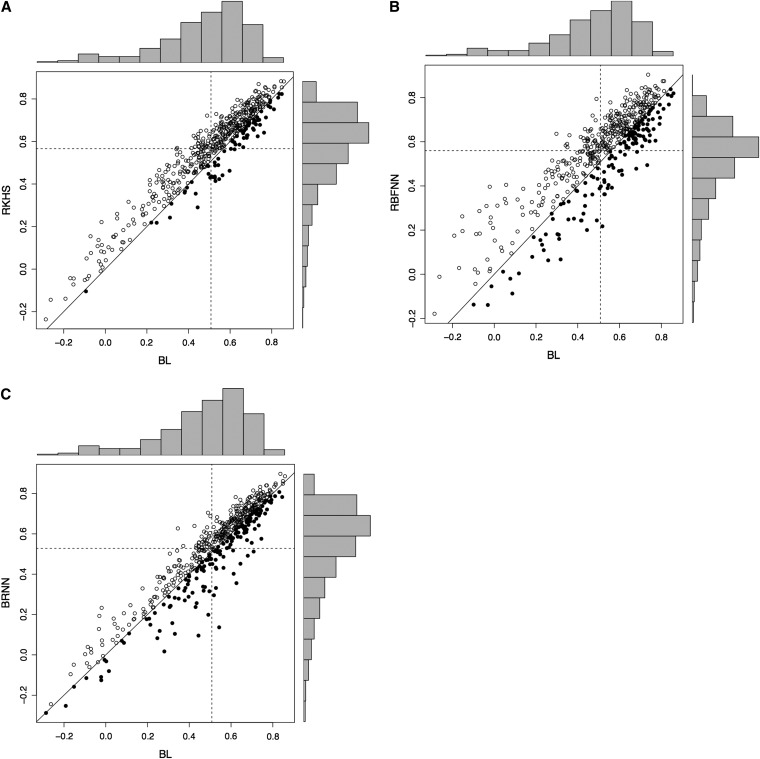
Figure 3 .
Plots of the predictive correlation for each of 50 cross-validation partitions and 10 environments for days to heading (DTH) in different combinations of models. (A) When the best non-parametric model is RKHS, this is represented by an open circle; when the best linear model is BL, this is represented by a filled circle. (B) When the best non-parametric model is RBFNN, this is represented by an open circle; when the best linear model is BL, this is represented by a filled circle. (C) When the best non-parametric model is BRNN, this is represented by an open circle; when the best linear model is BL, this is represented by a filled circle. The histograms depict the distribution of the correlations in the testing set obtained from the 50 partitions for different models. The horizontal (vertical) dashed line represents the average of the correlations for the testing set in the 50 partitions for the model shown on the Y (X) axis. The solid line represents Y = X; i.e. both models have the same prediction ability.

