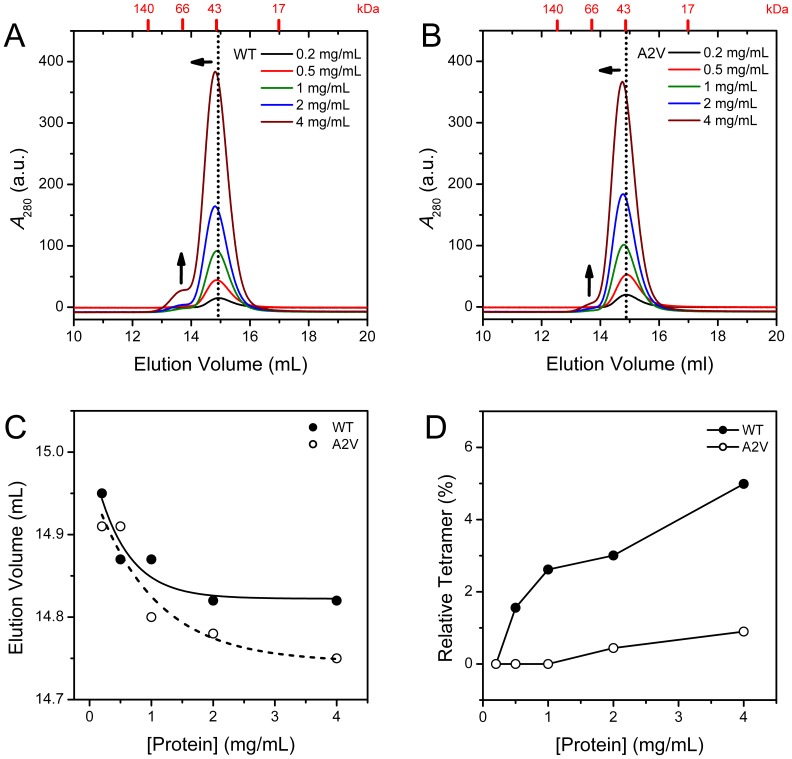
Figure 3. SEC analysis of the WT and mutated βB2-crystallins.
(A) SEC profiles of the WT βB2-crystallin. (B) SEC profiles of the A2V mutant. (C) Protein concentration-dependence of the elution volume of the dimer peak. (D) Protein concentration-dependence of the peak area from the tetramers. In panels A and B, the protein concentration-dependent changes of the peaks are indicated by the arrows. The positions of the standard molecular weight markers are shown at the top of the panels A and B. All samples were equilibrated for 2 h at 4°C before SEC analysis.

