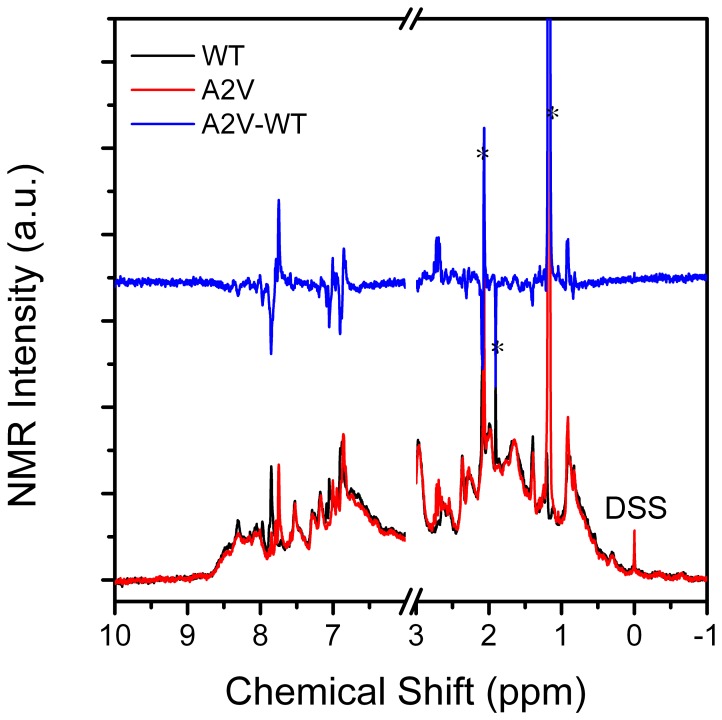
Figure 4. 1H-NMR spectra of the WT and mutated βB2-crystallins.
The 500 MHz 1H-NMR spectra were recorded using a protein concentration of 10 mg/ml at 20°C. The chemical shifts were referenced to DSS. The difference spectrum (blue) is obtained by subtracting the NMR spectrum of the mutated protein (red) by that of the WT protein (black). The asterisks indicate the peaks from the buffer.

