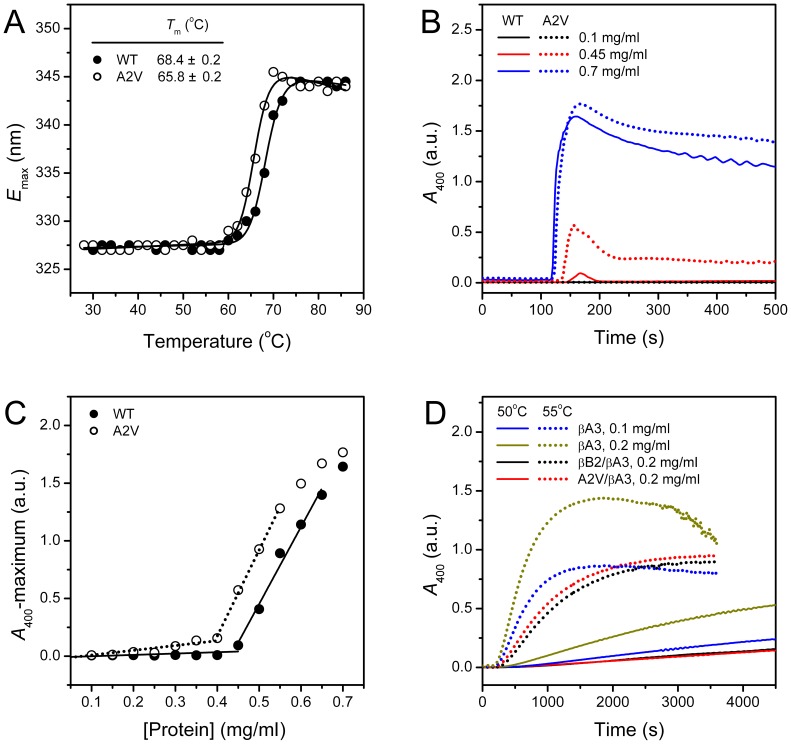
Figure 7. Thermal stability of β-crystallins.
(A) Equilibrium thermal transition curves from E max. The data were fitted by a two-state model, and the midpoints of unfolding (T m) are shown in the plot. The protein solutions were heated continuously by a water bath from 28°C to 86°C, and fluorescence spectra were recorded every 2°C after 2 min equilibration at the given temperature. (B) Concentration-dependence of the thermal aggregation kinetics. Only the representative kinetic data are presented. The protein solutions were heated at 70°C continuously, and the turbidity data were recorded every 2 s. (C) Relationship between the maximum turbidity and protein concentration. The data were fitted by two linear parts, and the fitting results are shown by lines. The turbidity values above 1.5 were not included in the fitting due to the limitations of the technique. (D) Protection of βA3-crystallin thermal aggregation by βB2-crystallin at 50°C (solid lines) or 55°C (dotted lines). The βB2/βA3-crystallin heteromer was prepared by incubating the mixtures containing equal molar of βB2- and βA3-crystallins for 20 h at 37°C.

