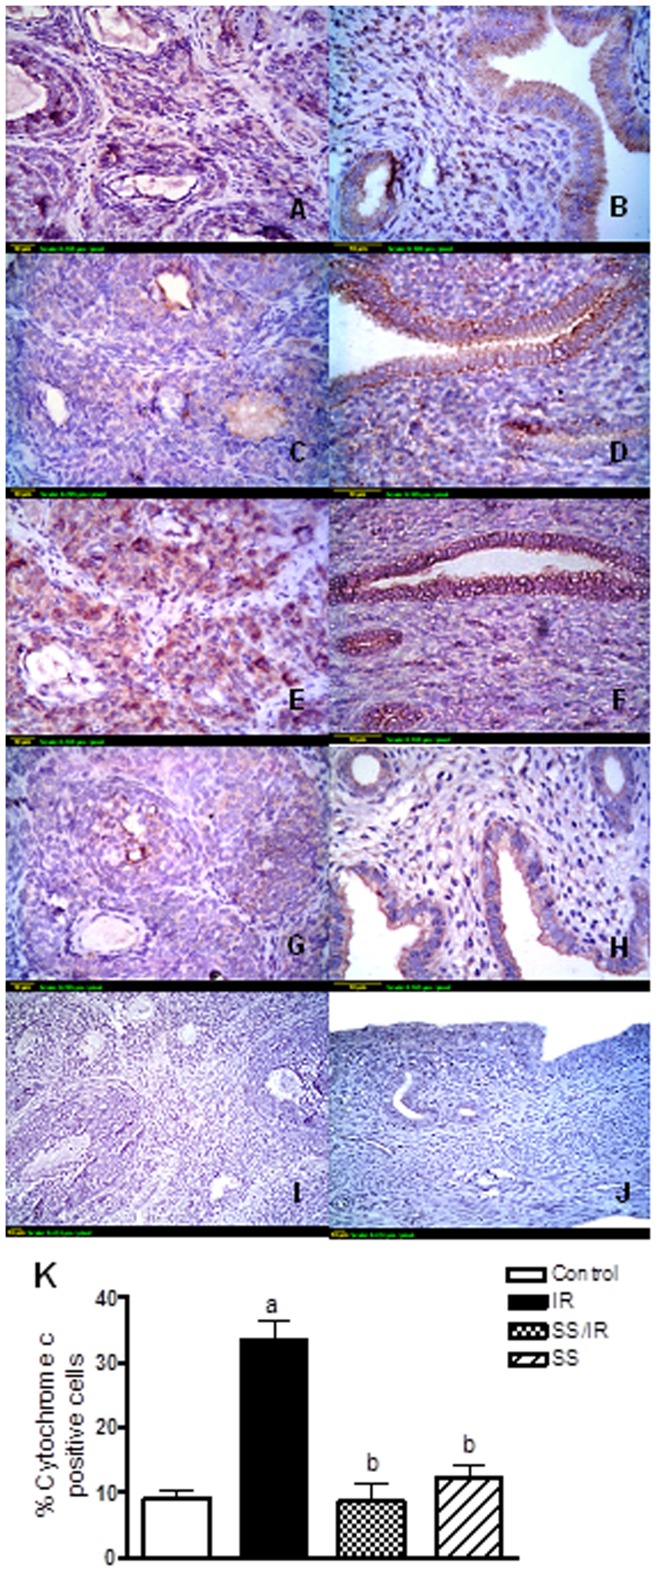
Figure 6. Immunohistochemical localization of cytochrome c.
(A & B) Sections of ovaries and uterus of control rats show a minimal degree of cytochrome c expression. (C & D) Sections of ovaries and uterus treated with sodium selenite (0.5 mg/kg) alone show a minimal degree of cytochrome c expression. (E & F) Sections of ovaries and uterus exposed to γ-radiation (3.2 Gy) show extensive cytochrome c expression. (G & H) Sections of ovaries and uterus treated with sodium selenite (0.5 mg/kg) and exposed to γ-radiation (3.2 Gy) show limited cytochrome c expression. (I & J): Sections of ovarian and uterine negative controls omitting primary antibody. Scale bar, 10 µm. (K): Quantification of ovarian cytochrome c staining represents the percent of immunopositive cells to the total area of the microscopic field (20×); averaged across 7 fields for each rat section. Each column represents the mean ± SD of at least three independent experiments. a or b: Statistically significant from control or irradiated group, respectively at P<0.05 using one-way ANOVA followed by Tukey–Kramer as a post-hoc test.

