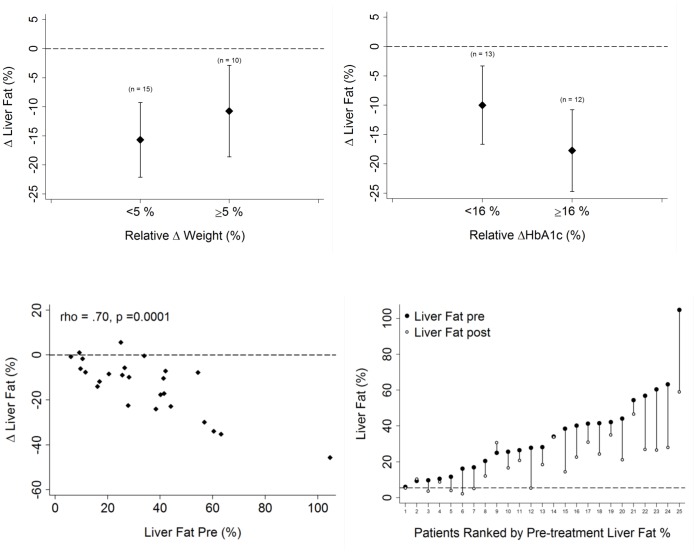
Figure 3. Upper Change in liver fat according to weight loss of <5% and >5% and according to relative reduction in HbA1c above or below median (median absolute reduction in HbA1c = 1.3%).
Lower: Change in liver fat according to pre-treatment liver fat percentage (left) and individual plots to demonstrate changes in liver fat ranked by pre-treatment liver fat percentage (right).

