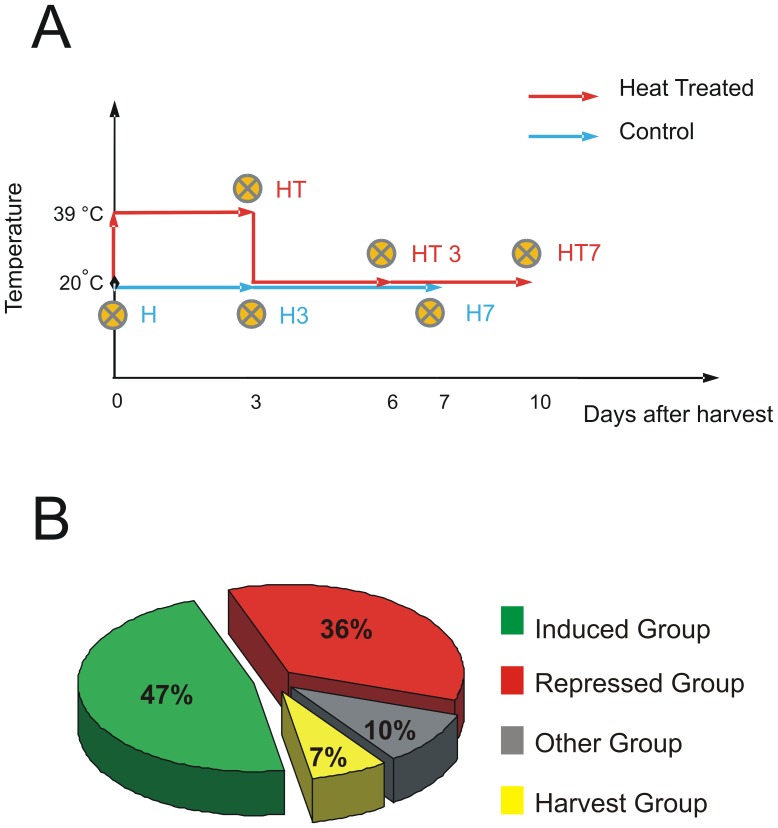
Figure 1. Treatments of peach fruits and clustering of the differential transcriptome. A. Schematic representation of Dixiland peach fruit samples employed for the transcriptomic analysis.
The differential transcriptome was obtained comparing fruits at six different stages: harvest time (H); after 3 and 7 days of harvest (H3 and H7, respectively) along the normal ripening process (light blue arrows) at 20°C; after the application of a heat treatment (upper red arrow) of 39°C during 3 days (HT) and after 3 and 7 days (HT3 and HT7, respectively) at 20°C after the heat treatment (lower red arrows) at 20°C. Both H3 and HT fruits have the same post-harvest lifetime. H7 and HT3 fruits have approximately the same post-harvest lifetime. However, HT7 fruits have no control counterparts of the same post-harvest lifetime. Crossed circles indicate the time-points of sample collection for the analysis. B. Pie chart representing the four clusters of unigenes of the differential transcriptome. Induced- and repressed-upon-heat-treatment unigenes were classified according to their expressional pattern (Table 1) and gathered into the IG and RG, respectively. These clusters represent 83% of the differential post-harvest transcriptome. OG includes unigenes whose differential expression pattern can not be related to the applied treatment. HG includes unigenes expressed at harvest stage and that are repressed during the ripening of fruits.

