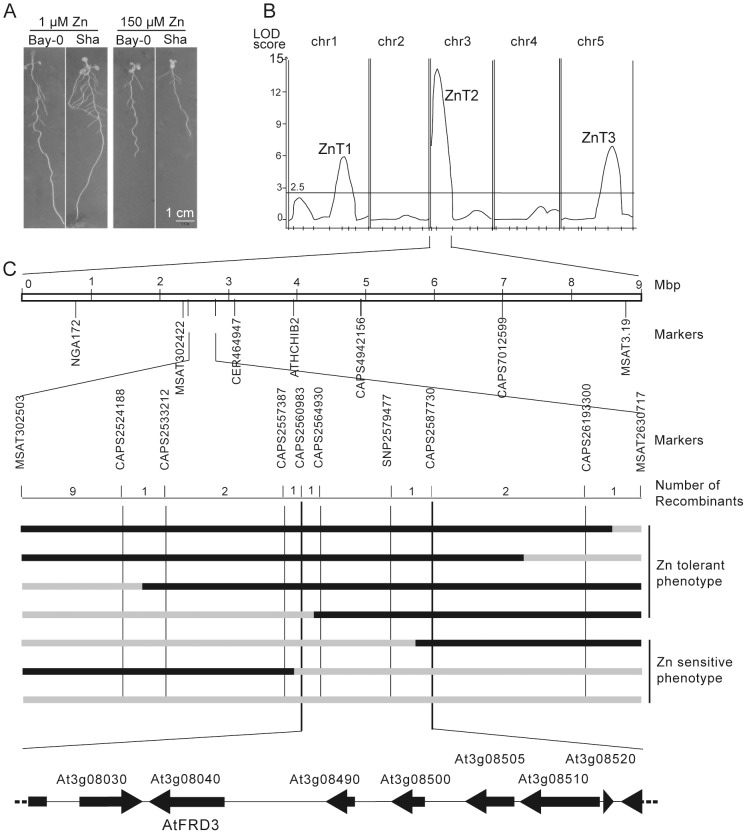
Figure 1. QTL and fine-mapping of the ZnT2 locus.
(A) Root phenotype of 10-day-old Bay-0 and Sha plants grown on agar plates containing 1 µM or 150 µM Zn. Bay-0 is more Zn-tolerant than Sha. Scale bar, 1 cm. (B) QTL map for the response of the primary root length to Zn (relative primary root length of plants grown at 150 µM and 1 µM Zn), evaluated in a sub-set of 165 RILs from the Bay-0×Sha RIL population. The map was obtained by composite interval mapping and a LOD threshold of 2.5 obtained from permutation. (C) Fine mapping of the ZnT2 QTL. ZnT2, initially mapped between markers NGA172 and MSAT3.19, was localized between MSAT302503 and MSAT2630717 and narrowed down to between CAPS2560983 and CAPS2587730 by recombinant screening. This 23 kb-long region encompasses 7 full-length genes including FRD3. Zn tolerance phenotypes of recombinant plants with informative genotypes are given. Black and grey bars represent Bay and Sha genomes, respectively.

